Join us in welcoming Al Jackson to the newly created Relationship Manager position. “Since joining us in June, Al is already making a positive impact on VNFA’s strong tradition of client service,” said Matthew Petrozelli, Chief Executive Officer. Al brings with him a wealth of experience and an unwavering passion for building and nurturing strong relationships. Al joined the team from Fidelity and has extensive client service and sales experience within the financial services industry.
Al is a Caldwell University graduate with a Bachelor of Science in Business Administration. He started his career in insurance and banking and has moved into the finance world over the years. “It is exciting to see someone of Al’s caliber join the firm as a Relationship Manager. His background with Fidelity brings a fresh perspective to the team and our clients,” said Jackie Gerstung, Client Service Manager.
Al, originally from New York, lives in the greater Lehigh Valley. He enjoys spending time with his wife and son. In his free time, Al dives into technology, specifically robotics and drone technology. Al is based out of our Bethlehem headquarters, and he can be reached at 610-868-9000 ext. 116 or ajackson@valleynationalgroup.com.
Disability Pride Month is an annual event held in July to celebrate and raise awareness about disability, promote disability rights, and advocate for greater inclusion and accessibility in all areas of society.
Disability Pride Month is a time to celebrate the diversity and contributions of people with disabilities, challenge negative stereotypes and discrimination, and work towards a more inclusive future for all.
Visit DCRC for more information on Disability Pride Month.
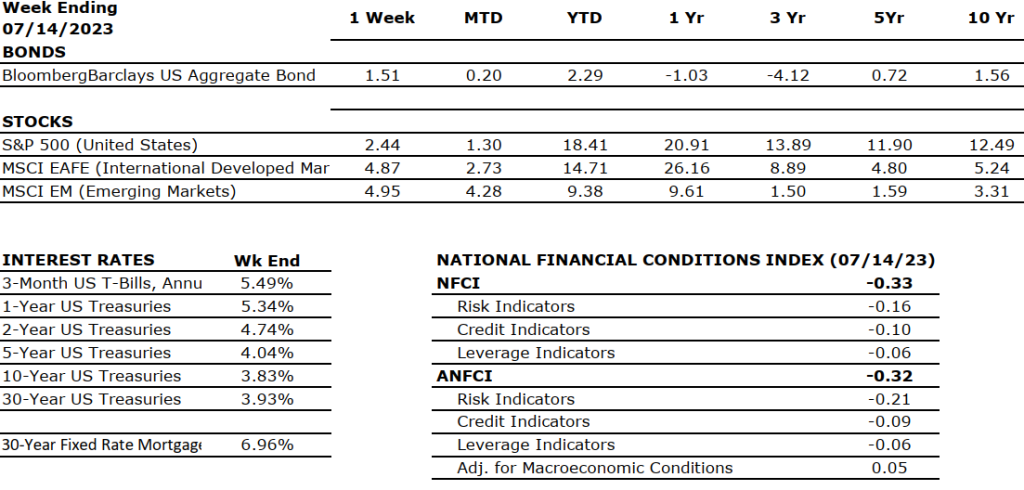
Falling inflation data, wide-spread market returns, and the reluctant acceptance by market participants that the Fed’s “Goldilocks” scenario of an economic soft-landing sparked solid returns across stock and bond markets. Last week’s markets finally showed signs of the broadening in equity returns we spoke of last week, with each major index returning weekly gains of more than 2%. Leading the way was the NASDAQ composite at +3.32% for the week, while the S&P 500 Index was up +2.42%, and finally, the Dow Jones Industrial Average notching a gain of +2.29%. The data below shows Year-to-date returns remain spread apart on the averages; however, each major index is up on the year. Meanwhile, US Treasury Bonds rallied (prices rose), with the 10-year US Treasury Bond falling 19 basis points to end the week at 3.83%.
US Economy
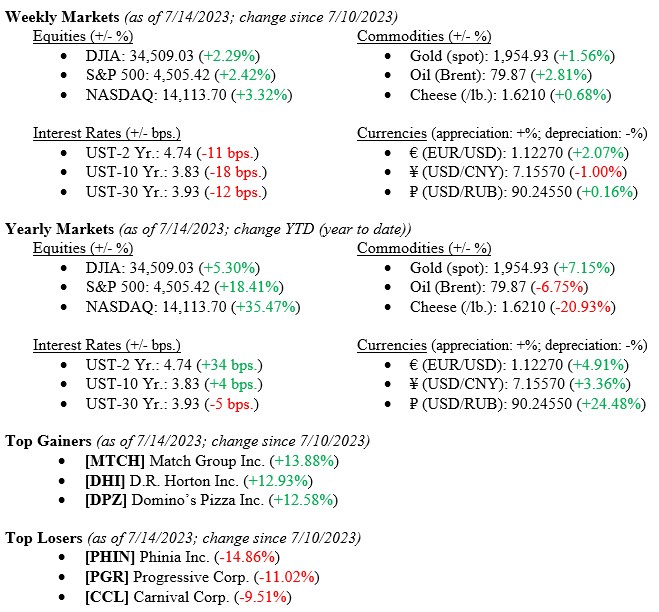
As mentioned above, the Bureau of Labor Statistics reported that the U.S Core Consumer Price Index and the U.S Core Producer Price Index, the Fed’s preferred measures of inflation, moved lower month-over-month and year-over-year. Chart 1 below from Valley National Financial Advisors and Y Charts shows Core Producer Price Index, Consumer Price Inflation, and the Target Fed Funds Rate. Chart 1 was the solid proof markets needed that inflation was falling due to the Fed’s aggressive interest rate hiking. This was important because, at the same time, the economy is still growing, companies are continuing to make money as Earnings Per Share remain positive, and the unemployment rate remains at a decades-low near record 3.60%.
Global Markets
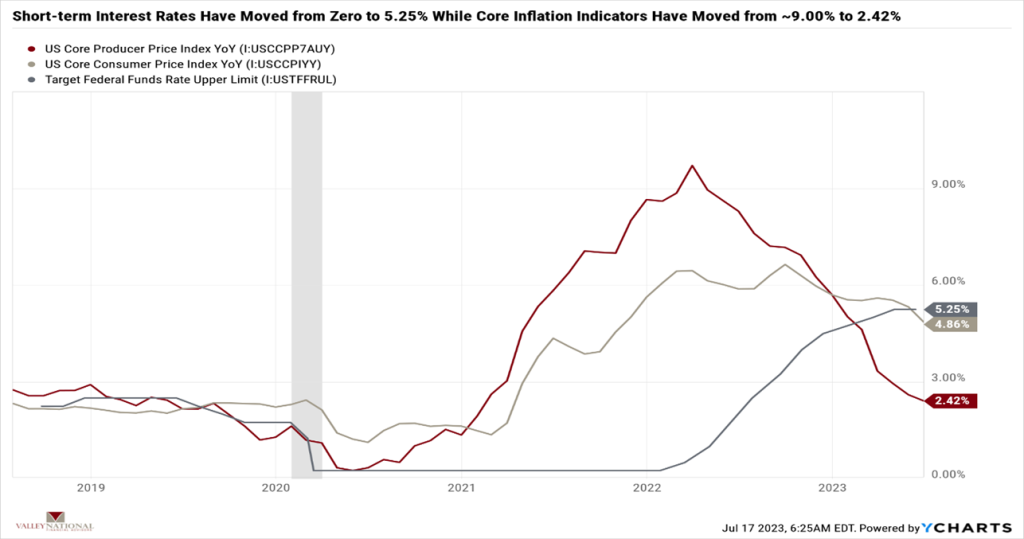
Last week’s gains in the equity markets were widespread. We believe this to be an important inflection point in the markets as equities beyond the “Big Seven” (Apple, Amazon. Com, Google, Microsoft, Meta, Nvidia, & Tesla) showed signs of positive momentum, which was needed to broaden out the technology-centered rally thus far in 2023. Chart 2 below from FactSet and Edward Jones breaks down returns year-to-date and valuations year-to-date. The broadening in market momentum shows room for further widening the breadth of returns as other sectors beyond the “Big Seven” participate going forward. We would not be surprised if the ‘Big Seven” continued to dominate market returns. Still, other sectors are poised to participate as the Fed is near the end of its rate hiking cycle, which was a significant headwind to markets. Inflation may soon be solidly behind us.
What to Watch
Monday. July 17th
U.S. Retail Gas Price at 4:30PM (Prior: $3.663/gal.)
Tuesday, July 18th
U.S. Retail and Food Service Sales MoM at 8:30AM (Prior: +0.34%)
U.S. Industrial Production MoM at 9:15AM (Prior: -0.16%)
U.S. Business Inventories MoM at 10:00AM (Prior: +0.16%)
U.S. Wholesalers Inventories MoM at 10:00AM (Prior: -0.10%)
Wednesday, July 19th
U.S. Housing Starts MoM at 8:30AM (Prior: +21.72%)
Thursday, July 20th
U.S. Initial Claims for Unemployment Insurance at 8:30AM (Prior: 237,000)
U.S. Existing Home Sales MoM at 10:00AM (Prior: +0.23%)
30 Year Mortgage Rate at 12:00PM (Prior: 6.96%)
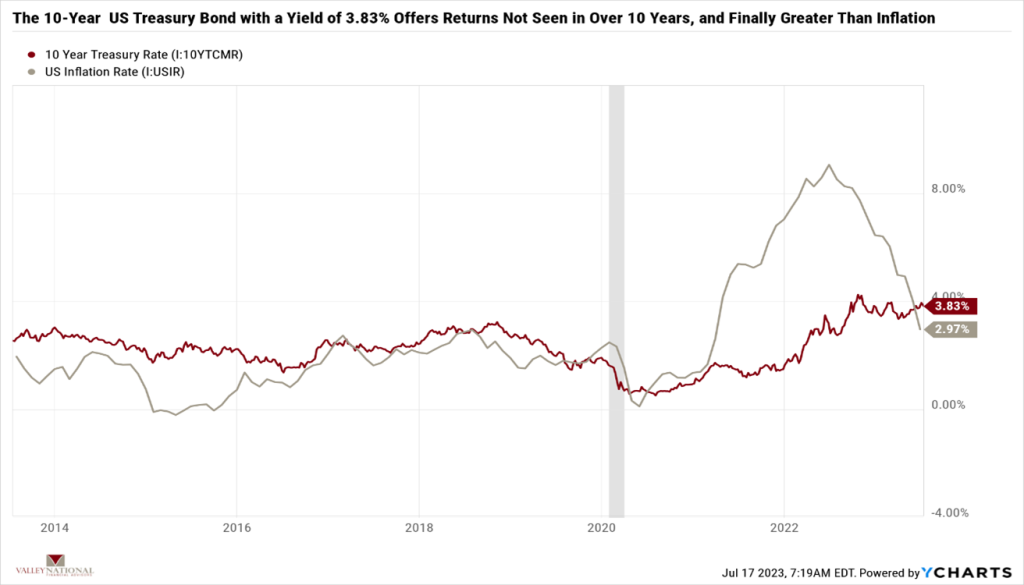
The “Goldilocks” soft-landing (cooling inflation while not killing the economy) may be playing out, yet we will not know until after all the data has been entered into the history books. We know today that inflation has come down, people have remained gainfully employed, and companies are making money. These factors have helped to push markets higher this year. Further, beyond equity returns in the technology sector and positive momentum in broadening sectors, bonds offer investors returns we have not seen in over ten years. The 10-year US Treasury Bond currently yields 3.83%. See Chart 3 below from Valley National Financial Advisors and Y Charts.
A risk-appropriate balanced portfolio with a broad selection of equities and bonds, while loaded with inherent volatility, still offers returns that, over time, will beat inflation and help investors create generational wealth. Contact your financial professional at Valley National Financial Advisors for assistance or questions.
Sources: Index Returns: Morningstar Workstation. Past performance is no guarantee of future results. Indices are unmanaged and cannot be invested into directly. Three, five- and 10- yearreturns are annualized excluding dividends.Interest Rates: Federal Reserve, Mortgage Bankers Association.
MARKET HEAT MAP
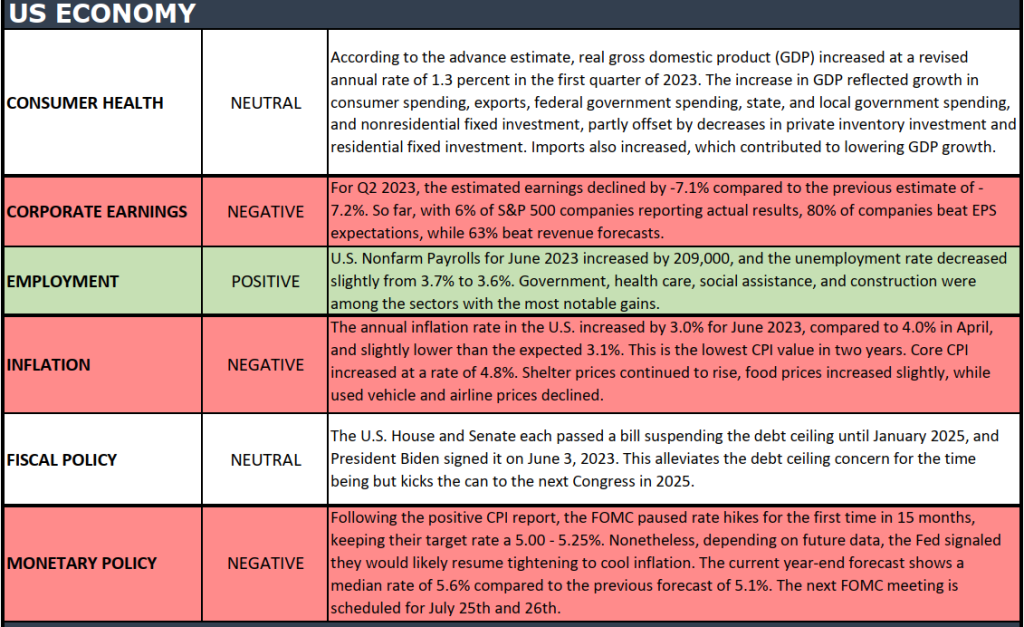
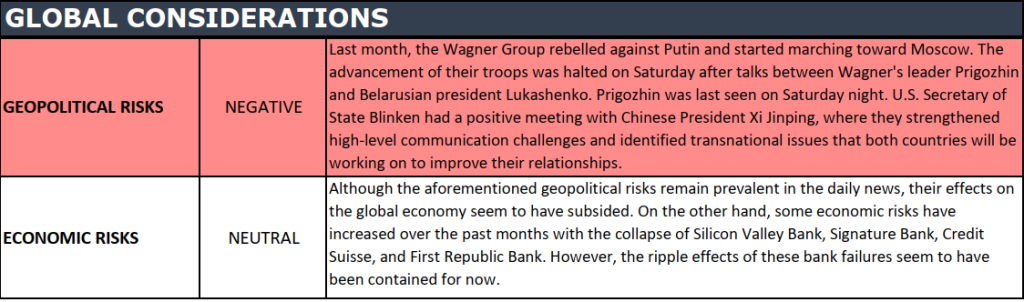
The health of the U.S. economy is a key driver of long-term returns in the stock market. Below, we grade key economic conditions that we believe are of particular importance to investors.
The “Heat Map” is a subjective analysis based upon metrics that VNFA’s investment committee believes are important to financial markets and the economy. The “Heat Map” is designed for informational purposes only and is not intended for use as a basis for investment decisions.