Current Market Observations

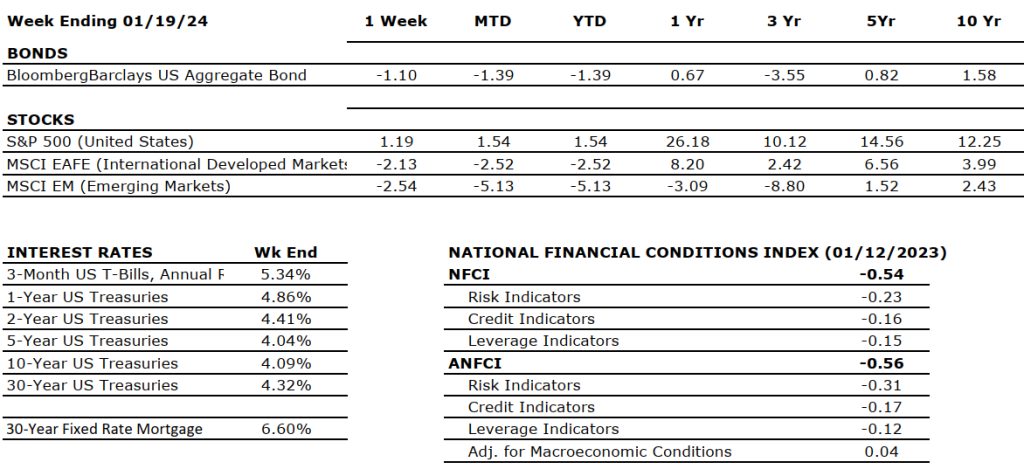
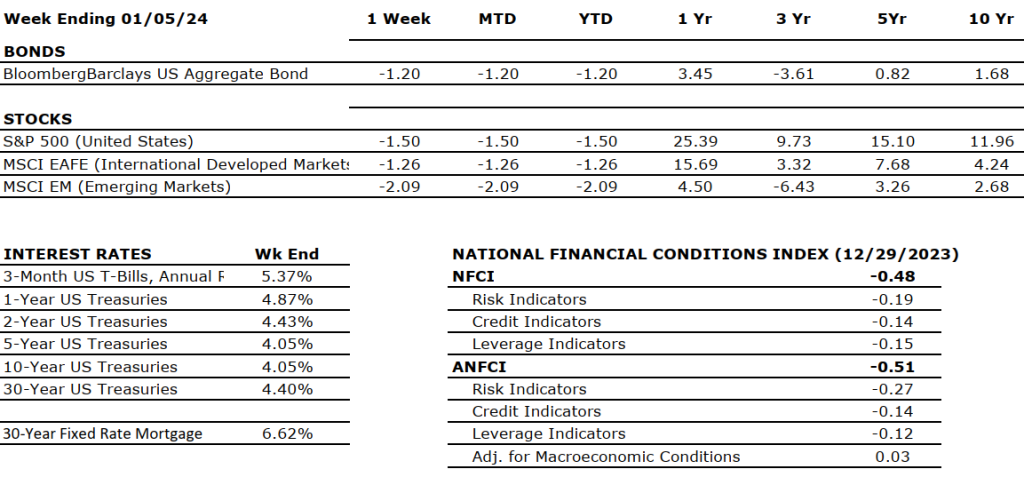
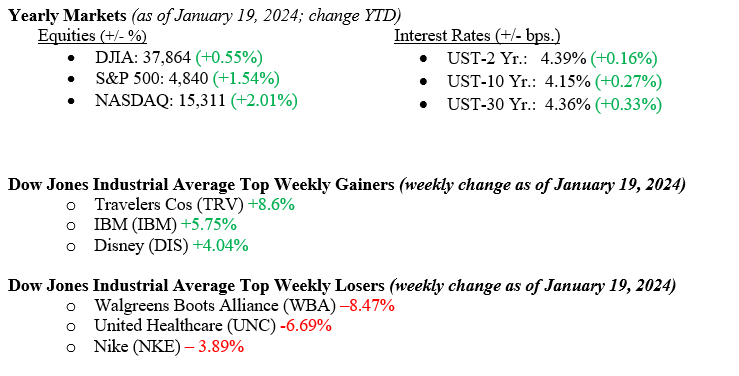
Equity markets ended last week by setting new all-time high records for the Dow Jones Industrial Average (+0.41%) and the S&P 500 Index (+1.25%), while the NASDAQ notched another winning week as well (+2.28%). Last week, the modest but record-setting move placed all three indexes in the green on a year-to-date basis (see numbers immediately below). The early slowness we saw in equity markets thus far in January resulted from investors and markets accurately resetting the timing and pace of the coming Fed rate cuts. At the end of 2024, futures markets were pricing in Fed rate cuts (often deemed positive actions for equity markets) as soon as March 2024. We have said previously, and stick to the conviction, that March was too soon and the likely path to lower Fed Funds Rates would be closer to June 2024. Futures markets have moved from a 100% chance of a cut in March to a 50% chance, which we believe is more accurate as inflation still has a bit more cooling to do before it settles around 2.00%. Interest rates increased last week, with the 10-year U.S. Treasury rising 19 basis points to 4.15%. Some strong economic data was released last week, including 4th quarter retail sales and consumer sentiment, which we will detail below.

U.S. Economy 

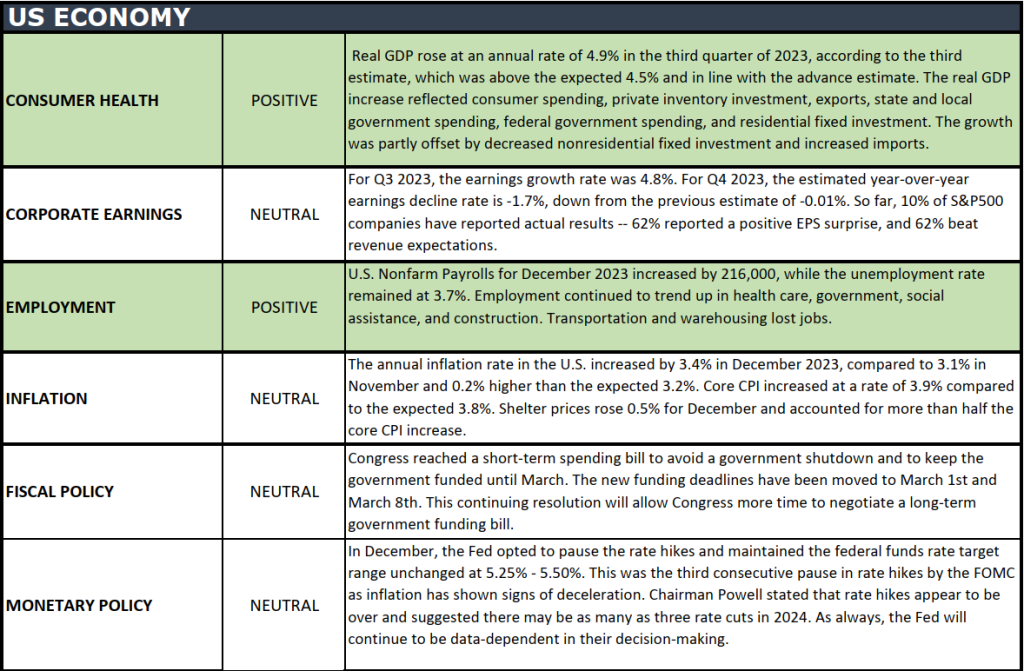
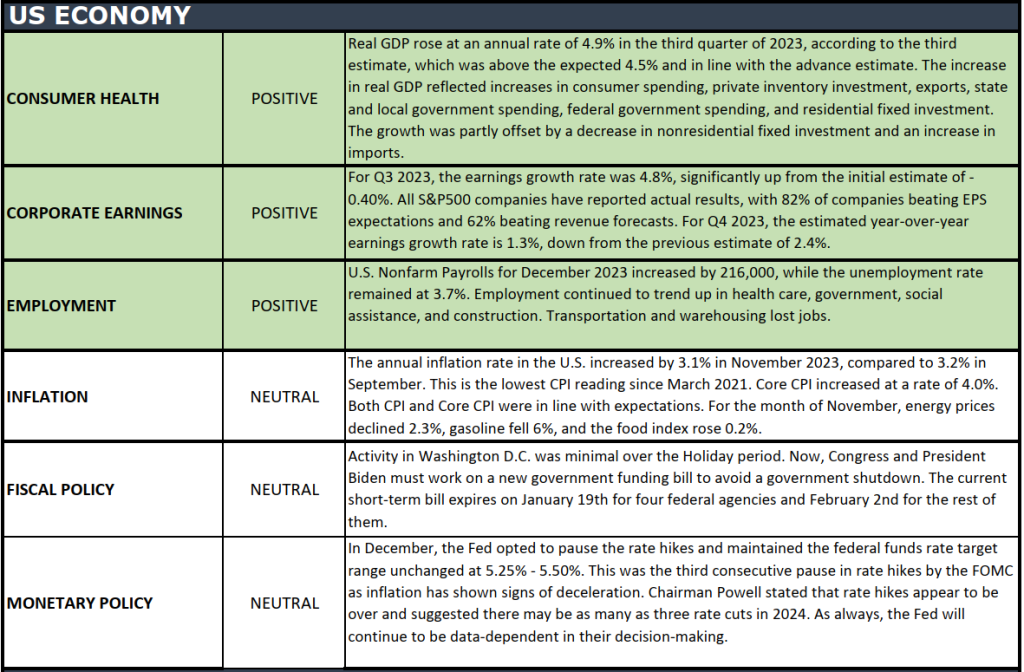
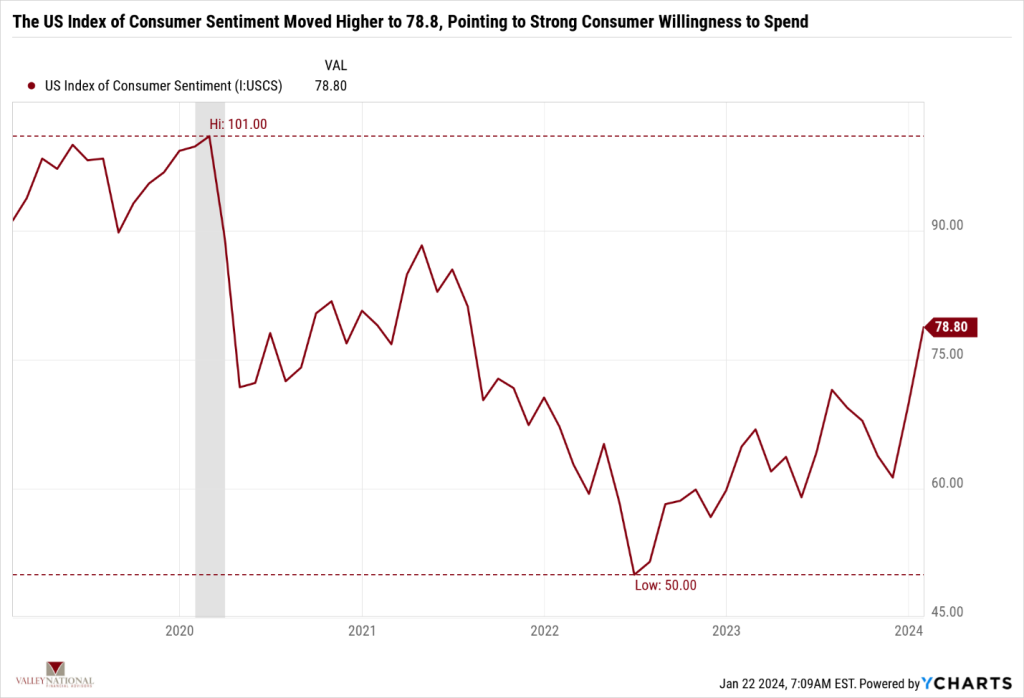
As mentioned above, U.S. Retail & Food Service Sales jumped +0.55% for December 2023, up from +0.35% for November 2023 and above the long-term average of +0.40%. This was confirmation that the year-end holiday shopping season was strong and, importantly, shows that consumers are not yet too tired to continue fueling the growing U.S. Economy. On the heels of that news, the U.S. Index of Consumer Sentiment, as the University of Michigan reported, jumped to 78.8, well off the recent low of 50.0 set in 2023. See Chart 1 below from Valley National Financial Advisors and Y Charts. It is important to note that a rising consumer sentiment index shows increased consumer confidence, which is generally evident in economic expansionary periods. While not the only predictor of future economic growth, this measure tells us what the consumer thinks about the future. This week, we will see real economic data when the 4th quarter of 2023 GDP is released. Additionally, we continue to monitor corporate earnings releases, which thus far have beaten, frequently softer, Wall Street analysts’ expectations.

Policy and Politics 

In positive news, the U.S. has avoided an embarrassing government shutdown as the dueling parties finally reached a budget deal. This week is the New Hampshire primary, where we get further indications of the presidential candidates for U.S. President in November 2024. While it is a foregone conclusion that President Biden will be the Democratic candidate, with Florida Governor Ron DeSantis dropping out, we are down to Nikki Haley and former President Donald Trump on the Republican ticket. All we have to say in this regard is that drama will follow. Markets are efficient, but politics are not. Stay tuned because as we move into the South Carolina primary and Super Tuesday in March, the final presidential battle will be formed.

What to Watch This Week 

• U.S. Durable Goods Monthly Orders for Dec 2023, released 1/25, prior 5.39%
• 30-year US Mortgage rate for week of Jan 25, released 1/25, prior rate 6.60%
• U.S. Initial Claims for Unemployment Insurance for week of Jan 20 released 1/25, prior 203,250.
• U.S. Core PCE Price Index for Dec 2023, release 1/26, prior 3.16%
• U.S. Real GDP for 4th Quarter 2023, released 1/26, prior 4.90%

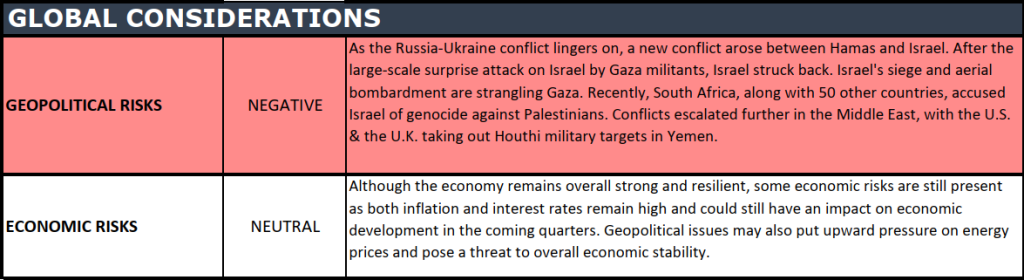
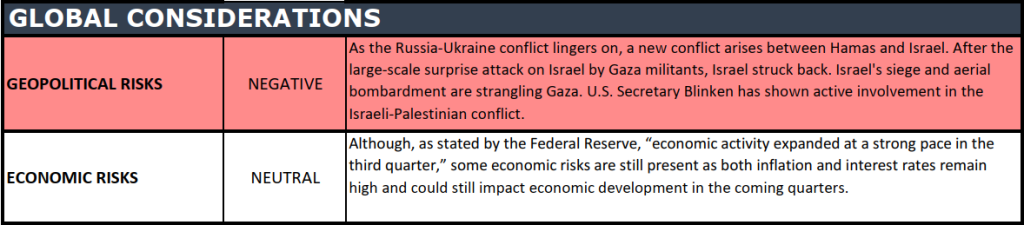
It is not news to The Weekly Commentary readers that the U.S. economy is ~70% consumption-based, meaning U.S. Consumers drive the largest part of the U.S. economic growth. Consumer sentiment is rising, and U.S. unemployment remains at historic low levels (3.6%). This is a simple equation – Americans are working, feel good about the economy, and will continue to spend. However, globally, turmoil and unrest abound. China continues to founder and is struggling to reach government-invented GDP targets. A brief look at headlines from the Middle East drums up issues that have lasted 75+ years with no end in sight for the Israel/Hamas War. The conflict has bubbled over into Iran, Yemen, and Lebanon and has impacted Red Sea commerce. The Russia/Ukraine War will soon move into its 3rd year, with no end in sight. While it is easy to see the U.S. as an island and immune to the World’s problems, our involvement with every conflict is usually inevitable. We expect markets to underprice the global turmoil and focus instead on eventual Fed rate cuts in 2024 as inflation moves closer to the Fed’s target of 2.00%. Corporate earnings growth in 2024 remains important, and we expect technology to remain the driver of growth and expansion this year. Expect volatility all year – but every year brings volatility, as we all know by now. Please reach out to your advisor at Valley National Financial Advisors for assistance.

The Numbers & “Heat Map”

MARKET HEAT MAP

The health of the U.S. economy is a key driver of long-term returns in the stock market. Below, we grade key economic conditions that we believe are of particular importance to investors.

The “Heat Map” is a subjective analysis based upon metrics that VNFA’s investment committee believes are important to financial markets and the economy. The “Heat Map” is designed for informational purposes only and is not intended for use as a basis for investment decisions.

Did You Know…?

The Martin Luther King, Jr. holiday holds the distinction of being the sole federal holiday designated as a National Day of Service. Each year, people across the United States seize the opportunity presented by MLK Day of Service to engage in volunteer activities and contribute to the betterment of their communities.

Want to learn more about Martin Luther King, Jr., National Day of Service, visit Unite, Serve, Transform on MLK Day.

Current Market Observations

We all know that streaks are meant to be broken, and last week, we broke the nine-weeklong streak of positive weekly gains in the stock market. It was to be expected as early in the year, many movements take place that bring stocks down, such as the beginning of the year’s positioning after year-end tax-loss harvesting. Either way, all three major indexes started off 2024 in the negative, with the Dow Jones Industrial Average falling –0.65%, the S&P 500 Index falling –1.80%, and the NASDAQ falling –3.78%. Looking at the Top Gainers vs. Top Losers in 2024, it seems like the opposite of 2023, which is comical. Apple, the big winner in 2023, is now the biggest loser! Oh, what a few days make in the efficient stock market. Articles and pundits everywhere are already talking about the end of Apple. We will keep watching the data. In the fixed-income markets, bonds also sold off last week, with the 10-year U.S. Treasury increasing by +0.17% to end the week at 4.05%. The yield curve (the slope of the line between 2-year yields and 10-year yields) remains inverted as it has been for over a year – with nary a recession in sight. 

U.S. Economy 

Last week saw an unexpected pop in the labor market, with Nonfarm payrolls increasing by 216,000 (higher than economist expectations) and the unemployment rate holding steady at 3.7%. This pair of data points set the stage for 2024, where labor continues to fuel economic expansion. Moreover, the Fed’s long sought-after “Goldilocks Soft-Landing” looks like a real possibility. The dramatic rise in interest rates over the past two years to slow inflation has not slowed the economy so much that we rolled into a recession. While this is good news for the economy, we must state that rate hikes take a long time to impact the economy, and we could still see some impacted slowdown ahead as we move forward. When cost-cutting is needed due to a slowdown in a service-based economy, the first thing to cut is jobs.

Policy and Politics 

Washington gets back to work this week (we say that with all the best intentions and not sarcasm), and the first item on the agenda will be funding the government before a partial shutdown on January 19, 2024. Each side will try to tie funding the government to border security and aid for Israel and Ukraine. With the billions of dollars flowing out of the U.S. for wars, it is hard not to feel the pressure on our own budget. Holding funds for our government to operate hostage because of funds desired for foreign operations seems anathema, but we are investors, not politicians. Of course, next week is the Iowa Caucus (January 15), and the week after that (January 23) is the New Hampshire Primary. We will then be moving into the full presidential election cycle. 

What to Watch This Week 

  • U.S. Inflation Rate for Dec 2023, released 1/11, prior rate 3.14% 
  • U.S. Consumer Prince Index Ex Food & Energy for Dec 2023, released 1/11, prior 4.01% 
  • U.S. Initial Claims for Unemployment for week of Jan 6, 2024, released 1/11, prior 202,000. 
  • 30-year Mortgage Rate for week of Jan 11, 2024, released 1/11, prior 6.62% 
  • U.S. Producer Price Index Ex Food & Energy for Dec 2023, released 1/12, prior 1.97% 

One week does not make a year or a market. Last week’s returns were attributed to positioning and the prior year’s tax loss harvesting. It is comical to see the economic press turn on Apple as fast as they did – from darling to dud in 5 days. From personal experience, the results received from Apple products like the iPhone, iTunes, and Apple TV+ are still positive in a meaningful way. As Fed Chairman Jay Powell continues to navigate the rate path in 2024, it is evident that we are not in the “pivot” stage where the next move from the Fed in rates is down. Of course, the timing of rate cuts is the real question. Markets are pricing in a March 2024 rate cut, and we think that may be a little too soon, given the economy’s continued strength, especially in the labor market. We will watch the data, pay attention to corporate earnings reports, and follow the news regarding world events and major elections. Reach out to your advisors at Valley National Financial Advisors for questions or help.

The Numbers & “Heat Map”

MARKET HEAT MAP

The health of the U.S. economy is a key driver of long-term returns in the stock market. Below, we grade key economic conditions that we believe are of particular importance to investors.

The “Heat Map” is a subjective analysis based upon metrics that VNFA’s investment committee believes are important to financial markets and the economy. The “Heat Map” is designed for informational purposes only and is not intended for use as a basis for investment decisions.

1099 Tax Reminders

As we bid farewell to 2023, it’s crucial for small business owners, self-employed individuals, and rental property owners to address their 1099 filing obligations. If your business/rental property made payments of $600 or more for services to non-employee individuals, you must file a 1099 form. Information relating specifically to Form 1099-NEC (Nonemployee Compensation) and 1099-MISC (Miscellaneous Income) can be found at https://www.irs.gov/instructions/i1099mec.

Form 1099-NEC must be mailed to the recipient and IRS by January 31st, regardless of if you electronically or paper file. Form 1099-MISC is also due to the recipient by January 31st, and to the IRS by February 28th, if you file via paper or March 31st, if you file electronically.