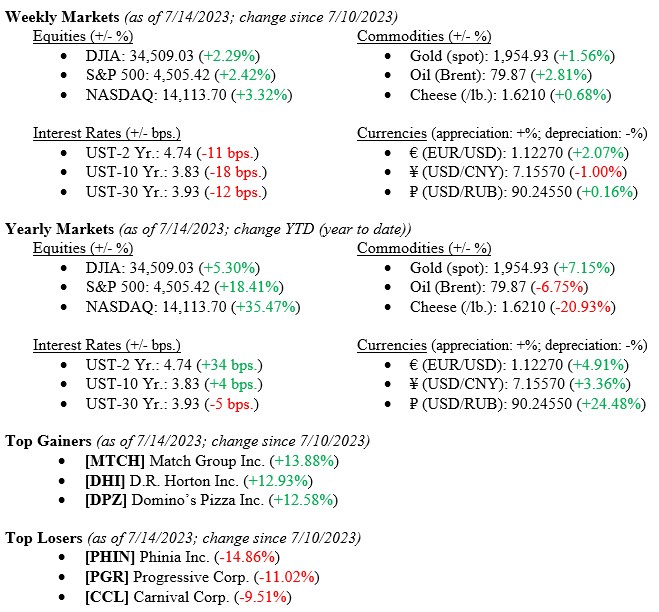
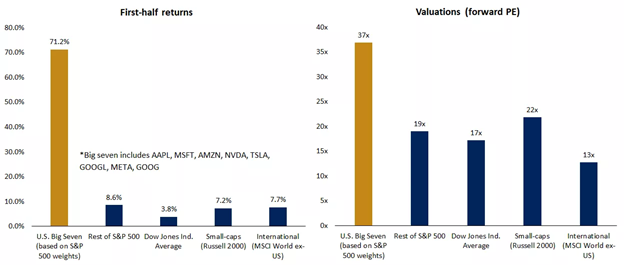
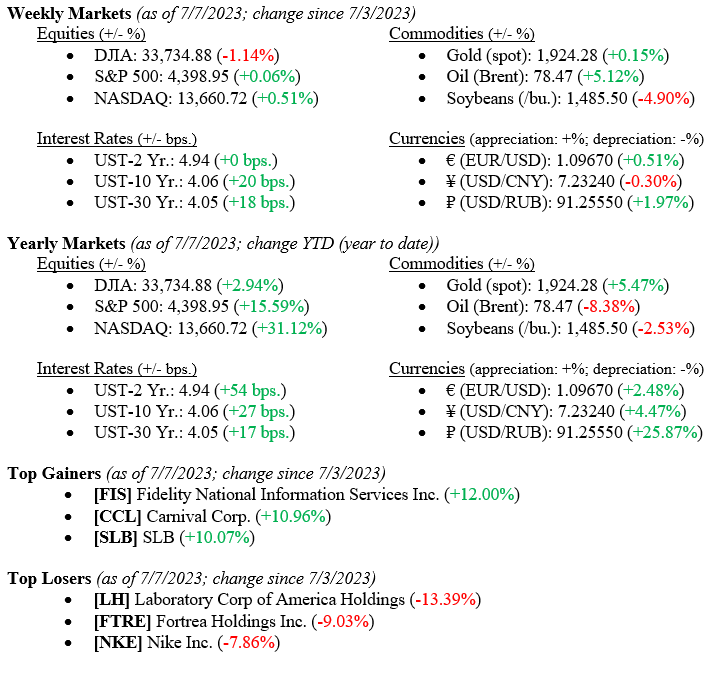
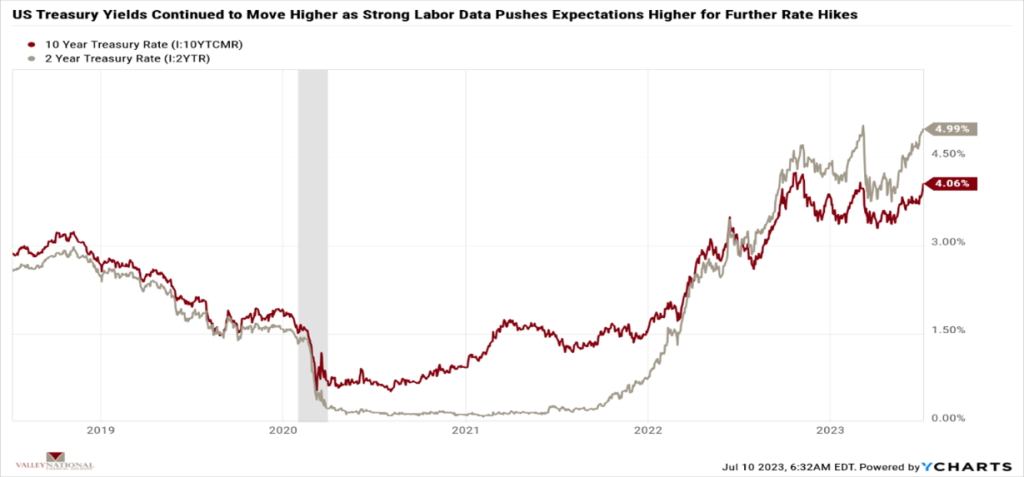
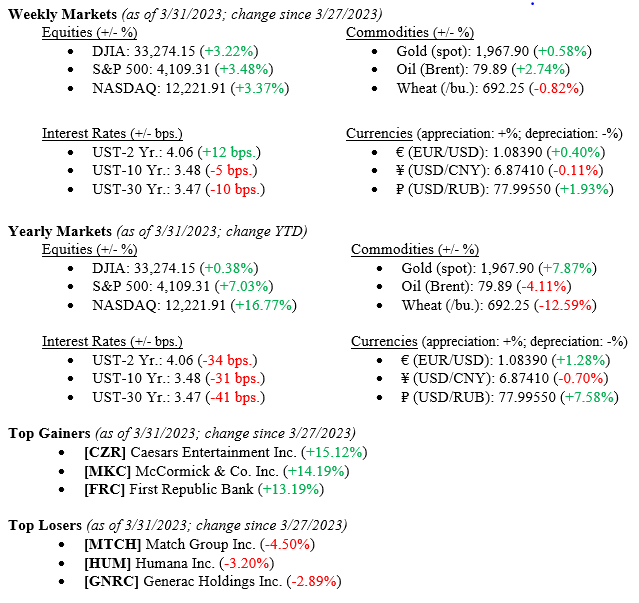
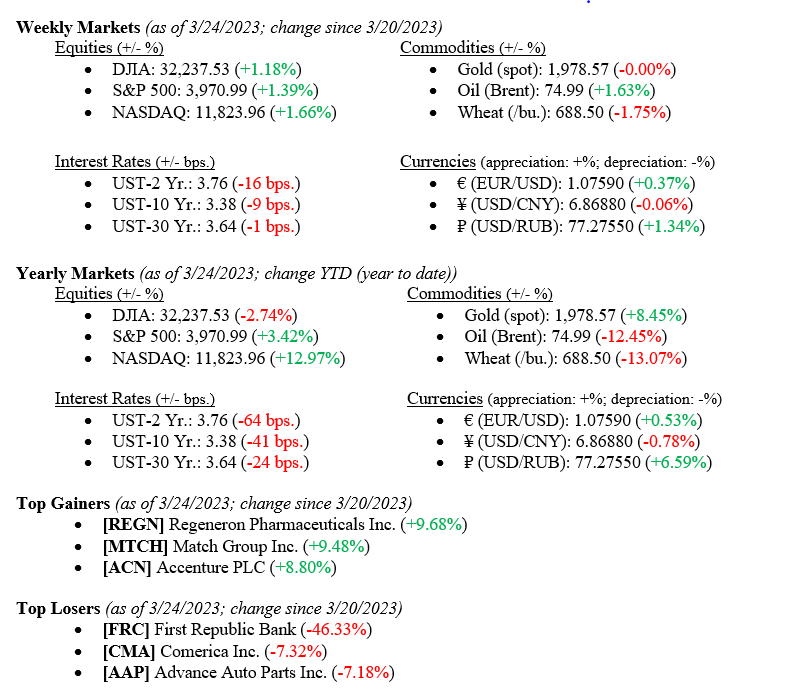
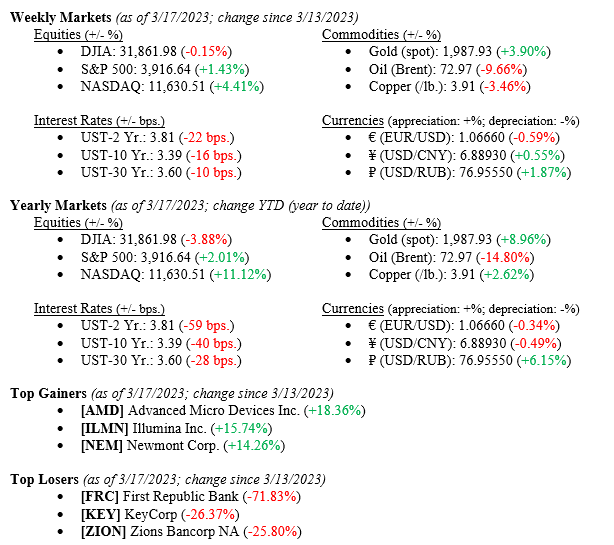
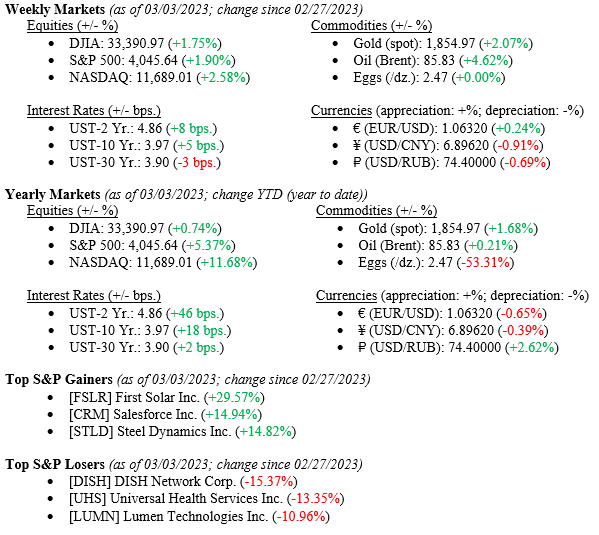
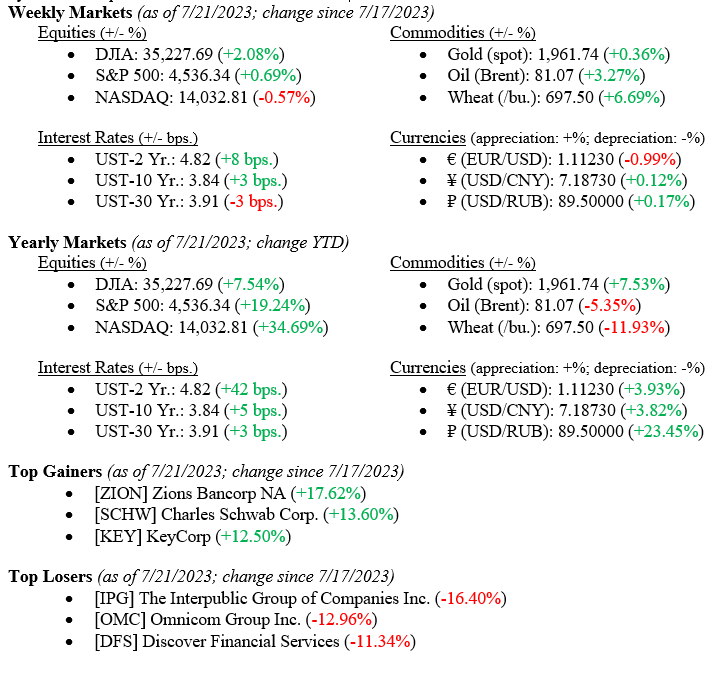
Equity markets posted mixed results last week, with the Dow Jones Industrial Average notching a +2.08% return, the S&P 500 Index moving higher by +0.69%, and the NASDAQ Index trailing the broader markets with a –0.57% return for the week. The broadening in equity market returns beyond simply technology stocks has continued for several weeks. This move has been expected as better valuations existed outside of the “magnificent seven” tech stocks that have thus far carried most of the gains in 2023. Year-to-date returns remain indicative of their expected risk levels, with the Dow Jones Industrial Average at +7.54%, the S&P 500 Index at +19.24%, and the tech-heavy NASDAQ at +34.69%. Fixed income markets were largely unchanged on the week, with the 10-year US Treasury Bond moving higher by three basis points to close the week at 3.84%.
Global Economy
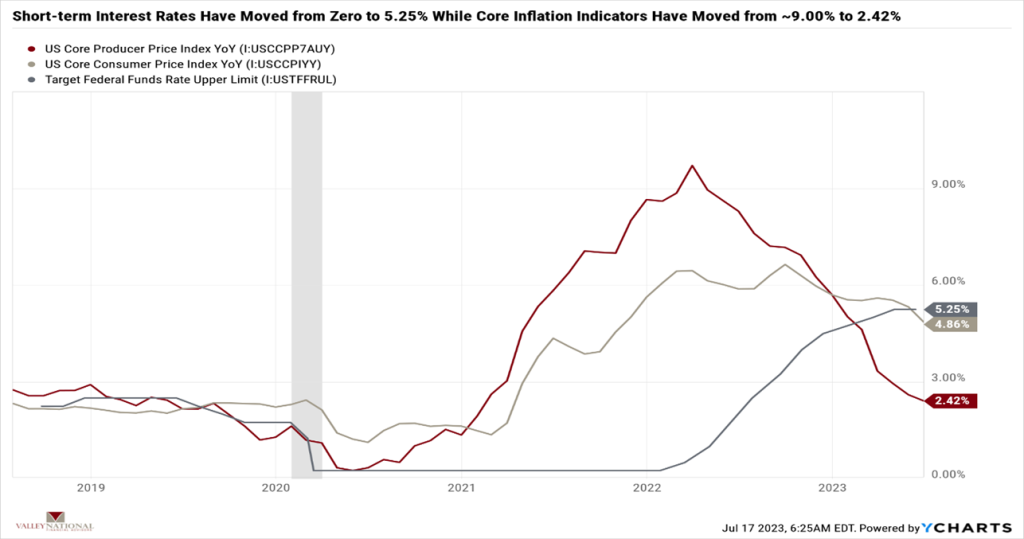
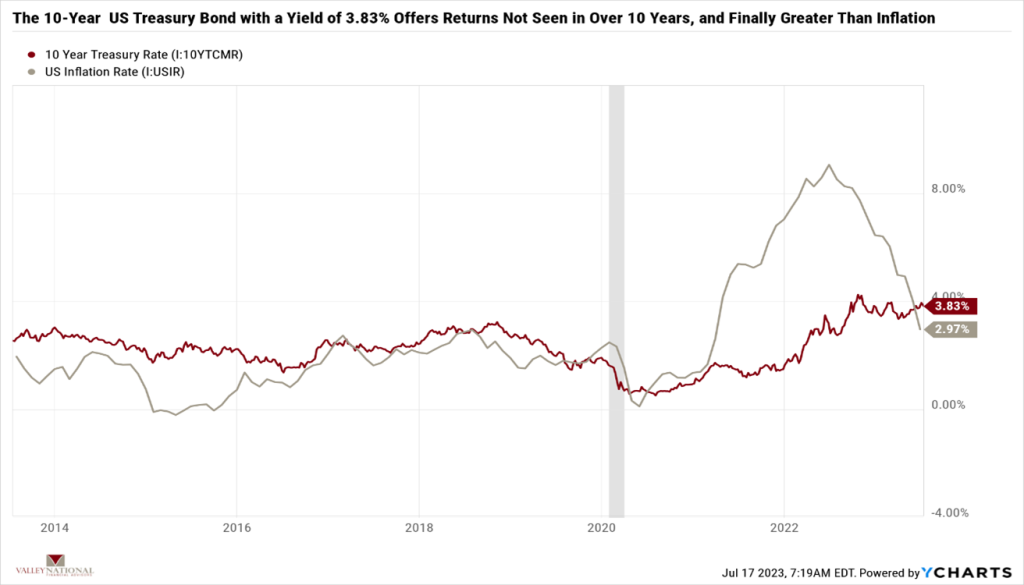
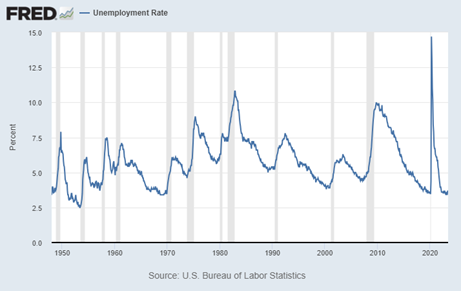
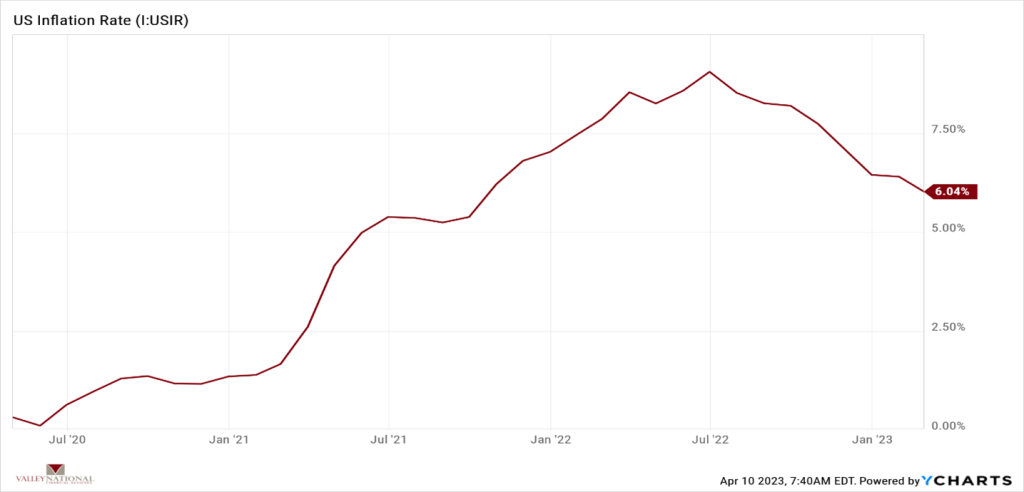
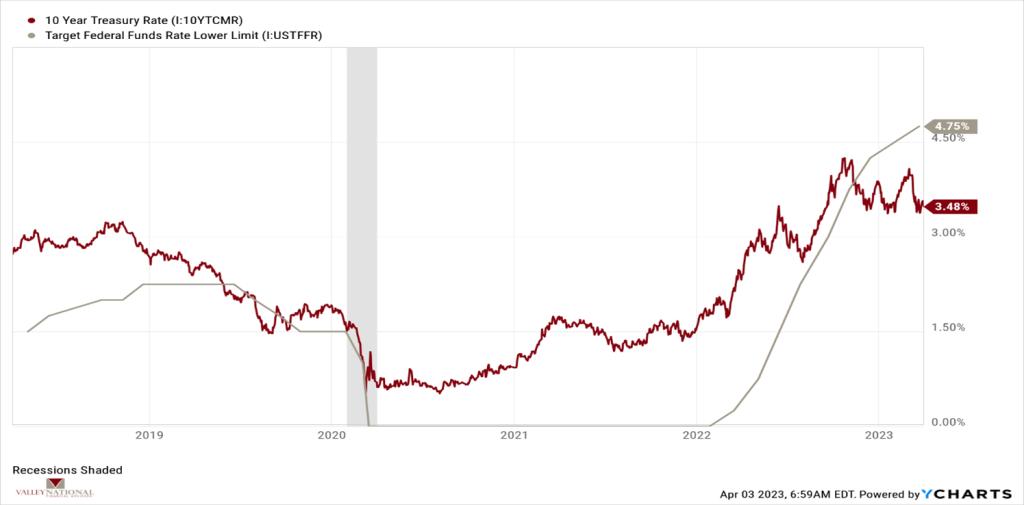
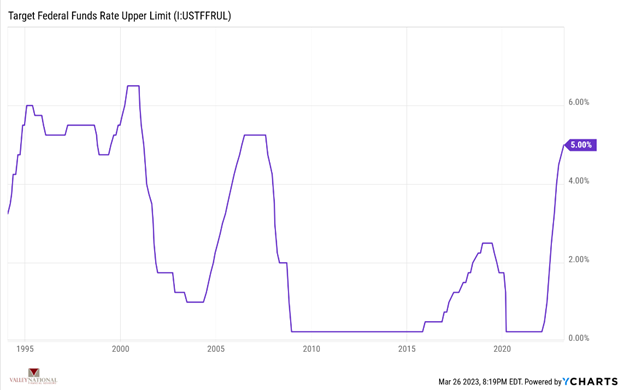
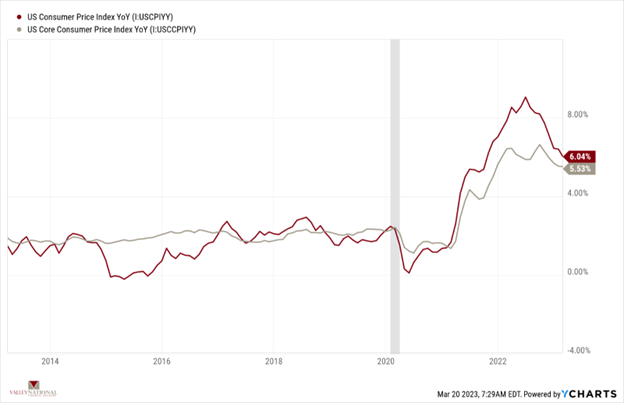
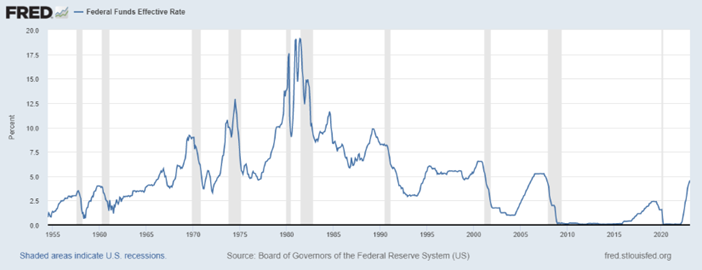
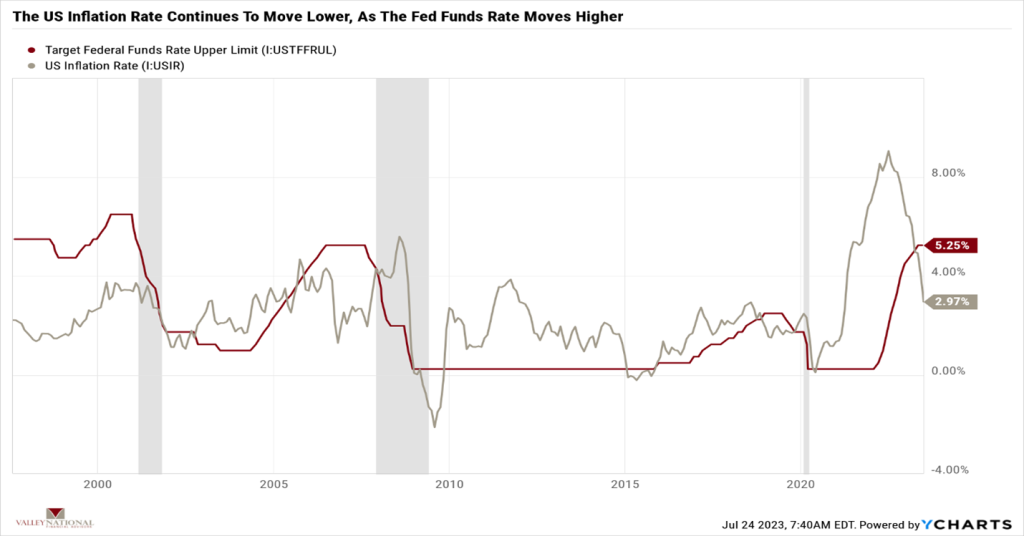
The Federal Open Market Committee (FOMC) meets this week, and most analysts are expecting another +0.25% rate hike, which will put the Fed Funds rate at 5.50% from 0.00%-0.25% at the start of 2022. We expect the Fed will be winding down its recent aggressive rate hiking strategy, which was related to spiking inflation in the United States and elsewhere. See Chart 1 from Valley National Financial Advisors and Y Charts showing the Fed Funds Rate and the U.S. Inflation Rate. The recent U.S. Inflation reading was 2.97%, down from over 9.00% in July 2022, so the Fed’s strategy is clearly working, and their target inflation rate of 2.00% is finally within reach. Still, we expect the path to 2.00% will be lumpy, slower, and longer than the path from 9.00% to 3.00%.
U.S. Economy & Market Outlook
Washington is on break until after Labor Day, and that has historically been “good news” for the markets because lawmakers are away and, therefore, unable to impact markets with harmful policies or procedures negatively. After calling for a recession in 2023, as many economists and “market experts” did in 2022, that same group has now walked back their predictions and pushed off any recession or soft-landing until well into 2024. With that said the markets are now focusing on earnings. Thus far in 2023, corporate earnings have been healthy, but markets are forward-looking, and we expect new tailwinds for corporate earnings going forward. Tailwinds will include relief on expenses as inflation continues to abate, normal supply chain operation, and the end of further rate hikes by the Fed. For the past year, we have only had headwinds, and markets have held up well; tailwinds will bring new directions to the market, but again, expect volatility, as always.
What to Watch
- Monday, July 24th
- U.S. Retail Gas Price at 4:30PM (Prior: $3.676/gal.)
- Tuesday, July 25th
- Case-Shiller Home Price Index: National at 9:00AM (Prior: 299.72)
- Wednesday, July 26th
- U.S. Job Openings: Total Nonfarm at 10:00AM (Prior: 9.824M)
- Target Federal Funds Rate Upper Limit at 2:30PM (Prior: 5.25%)
- Thursday, July 27th
- U.S. Real GDP (Gross Domestic Product) QoQ at 8:30AM (Prior: 2.00%)
- 30 Year Mortgage Rate at 12:00PM (Prior: 6.78%)
- Friday, July 28th
- U.S. Core PCE (Personal Consumption Expenditure) Price Index MoM/YoY at 8:30AM (Priors: 0.30% / 4.62%)
- U.S. Personal Income MoM (Month Over Month) at 8:30AM (Prior: 0.40%)
- U.S. Personal Spending MoM at 8:30AM (Prior: 0.10%)
- U.S. Index of Consumer Sentiment at 10:00AM (Prior: 72.60)
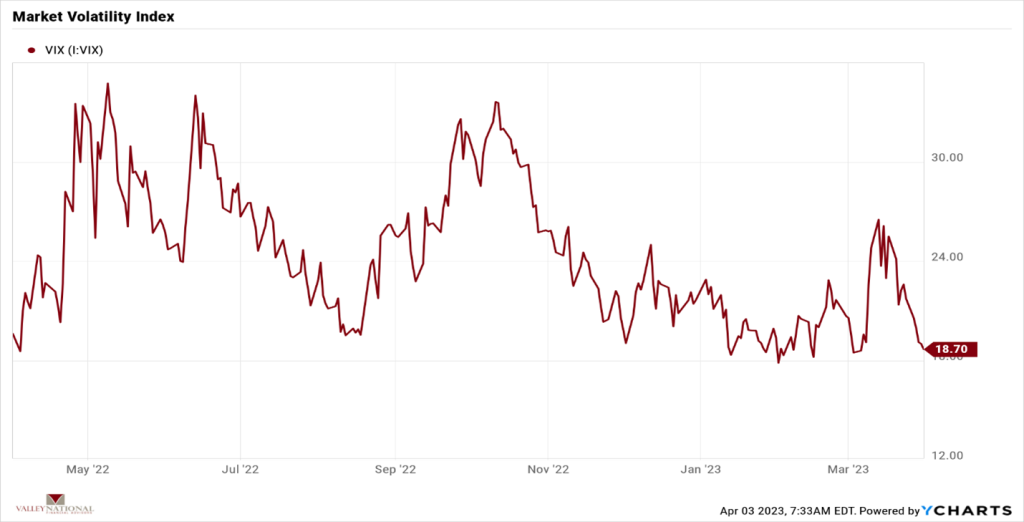
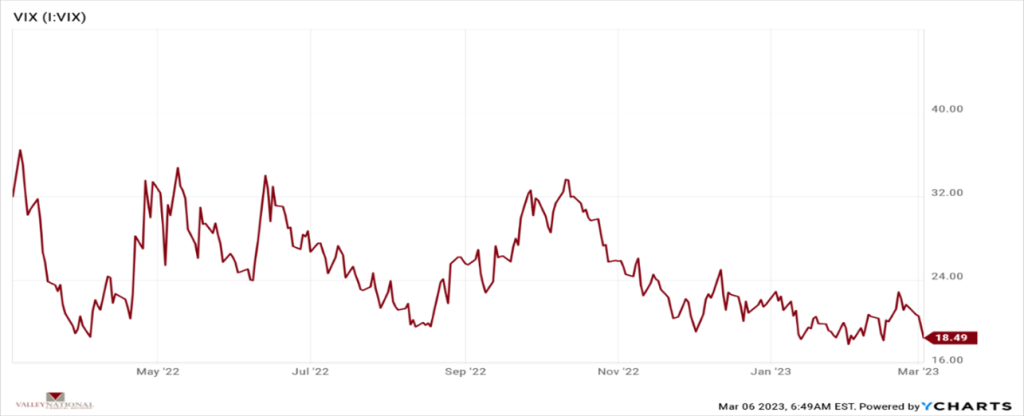
Equity markets continue to move higher, and the recent broadening of positive returns to cyclical stocks from only technology stocks adds to the breadth the market was lacking. Certainly, our antennas remain active any time the markets move higher with such muted volatility. The current VIX (Volatility Index) is 14.0, a near-record low. 2008/09 VIX measured 81.0 and 76.0 at the peak of the Pandemic. Many investors spent the first half of 2023 on the sidelines waiting for the recession that would never impact the market. Meanwhile, markets have steadily moved higher all year, and new tailwinds have emerged for corporate earnings in the form of lower expenses and a clearer path from the Fed on interest rate moves. Emergent consumer technologies like AI (Artificial Intelligence) might further impact expenses. Though the eventual impact of AI is unknown, one must pay attention to innovation and its potential global importance.