
“Be willing to be a beginner every single morning.” – Meister Eckhart
Did You Know…? Easter indicates the onset of spring, a time of renewal and optimism!
This holiday, celebrated globally, signifies fresh beginnings and the spirit of hope. Festivities include cherished customs like Easter egg hunts, the iconic Easter Bunny, and vibrant spring festivals.

The Easter Bunny brings joy to children, rewarding them for their excellent behavior throughout the year. Alongside these cherished traditions, many welcome the arrival of spring by spending time in their backyards planting flowers, engaging in more outdoor events, and joining in community festivities. What will you be doing to kick off the start of spring?
As Easter approaches on Sunday, March 31, 2024, let us treasure our loved ones, enjoy spring blossoming, and share happiness wherever we go. Your VNFA family wishes you a joyful Easter filled with love and laughter.
Current Market Observations
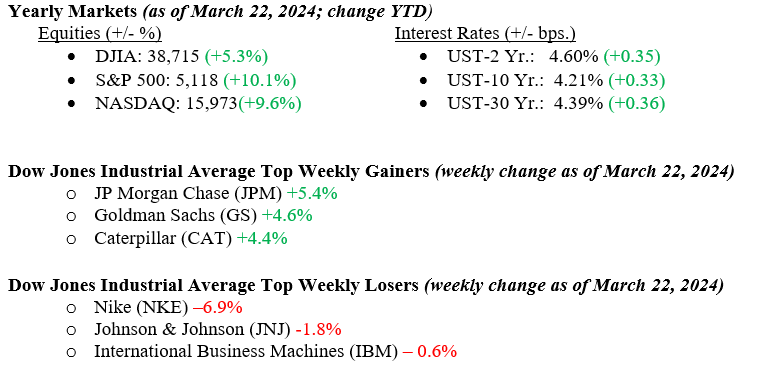
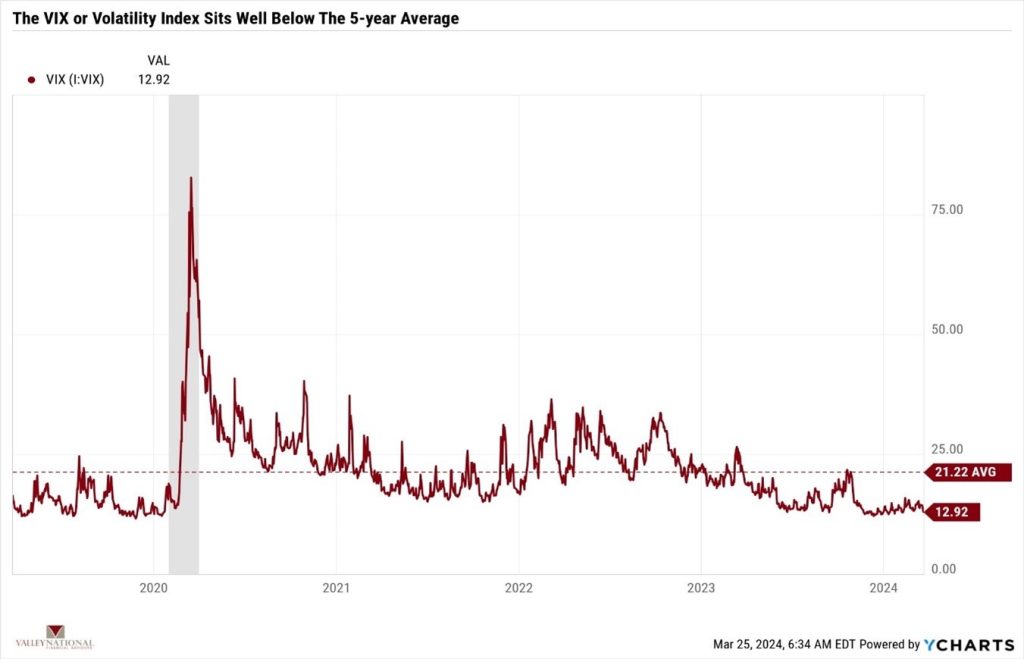
Last week, the Federal Reserve’s more dovish tone was well received by the markets. The Dow Jones Industrial Average rose 2.0%, the S&P 500 Index rose 2.3%, and the NASDAQ rose 2.9%. Communication services were the best-performing sector for the week (+3.9%), while healthcare was the worst-performing sector (+0.5%). The CBOE Volatility Index fell about 9% for the week, indicating greater confidence and calmness among investors (See Chart 1 below). The latter part of the week saw market participation broadening beyond mega-cap stocks, with small and mid-cap stocks performing well. With the Fed’s rate outlook intact, the 10-year treasury saw increased buying, pushing yields down 12 basis points for the week.
U.S. Economy
As mentioned above, the CBOE Volatility Index fell again last week. The index measures the implied expected volatility of the U.S. stock market. VIX (Volatility Index) is used as a barometer for fearful and uncertain markets. The VIX tends to increase when the market decreases and vice versa. During the financial crisis in 2008-2009, the VIX reached as high as 80.86. See Chart 1 below from Valley National Financial Advisors and Y Charts shows the VIX over 5 years.
The FOMC meeting went as expected, with Chairman Powell stating that the current path for rate cuts remains on track, and they plan on up to three rate cuts by year-end 2024. Just as important as the rate cut story, the FOMC announced an increase in their projections for economic growth in 2024 from 1.4% to 2.1%, thus cementing the so-called “soft-landing” scenario. Specifically, Chairman Powell noted, “The economy is strong, the labor market is strong, and inflation has come way down.” Lastly, Powell mentioned that it was appropriate for the Fed to slow the pace of its balance sheet reduction program, which has been another source of restrictive monetary policy.
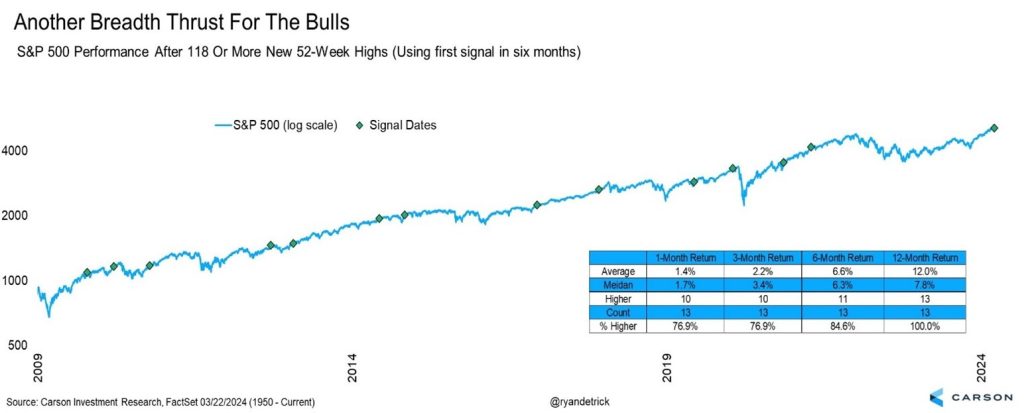
Thursday saw 118 new 52-week highs for the S&P 500, the newest highs in 3 years. The prior 13 times this number of 52-week highs was reached resulted in higher stocks one year out 13 out of 13 times, with the average return being 12%, see Chart 2 below from the Carson Institute.
Policy and Politics
Global turmoil escalated last week with an ISIS-linked terrorist attack in Moscow shortly after Vladimir Putin was reelected to another six-year term. Further, the Ukraine/Russia and Israel/Hamas wars are showing no signs of ending. In Washington DC, President Biden signed a $1.2 trillion spending package that was previously passed by the U.S. House and U.S. Senate, thus narrowly avoiding an embarrassing government shutdown. With this out of the way for Washington, DC, we will move heavily into the 2024 campaign season with both political parties (Democrats & Republicans) vying for wins in November.
Economic Numbers to Watch This Week
- U.S. Durable Goods New Orders MoM for Feb 2024, prior –6.11%
- U.S. Initial Claims for Unemployment Insurance for the week of March 23, 2024, prior 210,000
- U.S. Real GDP (Gross Domestic Product) QoQ for Q$ 2023 (Revised), prior 3.20%
- U.S. Index of Consumer Sentiment for March 2024, prior to 76.50.
- 30-year Mortgage Rate for the week of March 28, 2024, prior to 6.87%
- U.S. Core PCE (Personal Consumption Expenditures) Prince Index YoY for Feb 2024, prior 2.85%
Last week, several encouraging signs for the economy and markets were observed. The Federal Reserve left rates unchanged at their Wednesday meeting while upgrading their GDP growth projections and highlighting the strength and resilience of labor markets. Despite a recent blip in inflation readings, the trend lower appears intact, and the Fed continues to see three rate cuts coming later this year. Lower rates will serve as a tailwind to the housing market, which reported improved existing home sales last week. Despite these encouraging signs, we remain focused on identifying emerging market risk areas. We will continue to look for investment opportunities where the risk vs reward tradeoff looks the most compelling. Please reach out to your advisor at Valley National Financial Advisors with any questions.
From the Pros… VIDEO
“Your Financial Choices” Radio
Tune in Wednesday, 6 PM, “Your Financial Choices” on WDIY 88.1 FM. Laurie will be discussing: Random Thoughts on Financial Topics.
Questions can be submitted to yourfinancialchoices.com before the live show. Recordings of past shows are available to listen to or download at yourfinancialchoices.com and wdiy.org.
Did you miss the last show, Inheriting Something? What should you know? Listen Here
The Numbers & “Heat Map”
MARKET HEAT MAP
The health of the U.S. economy is a key driver of long-term returns in the stock market. Below, we grade key economic conditions that we believe are of particular importance to investors.
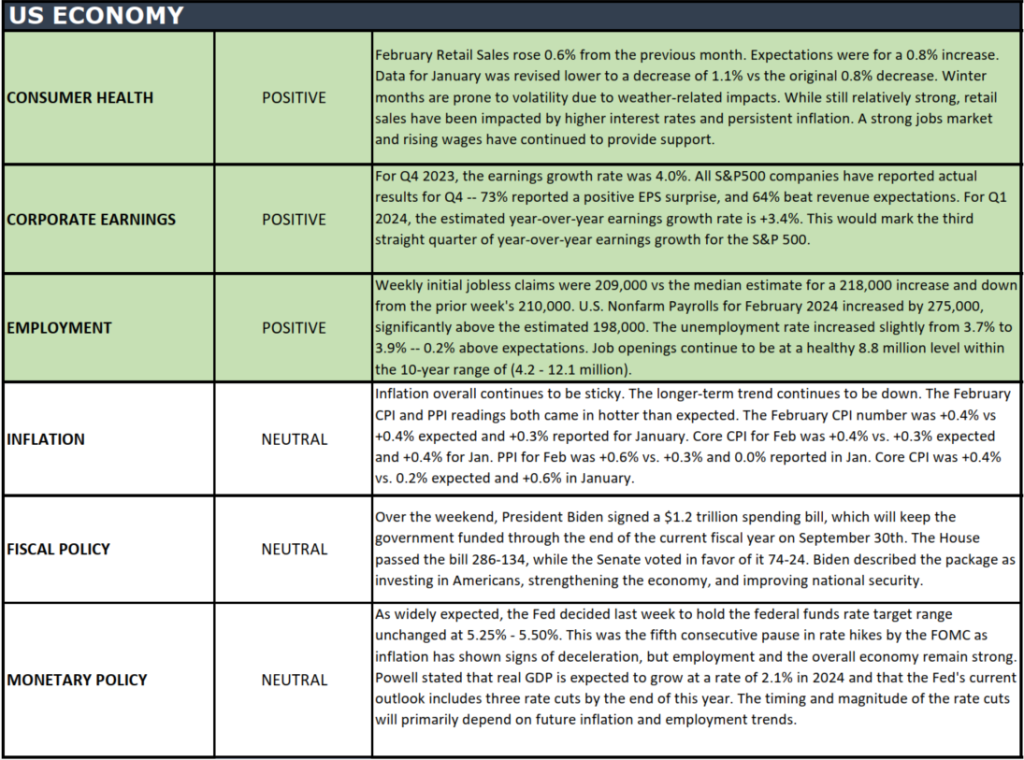
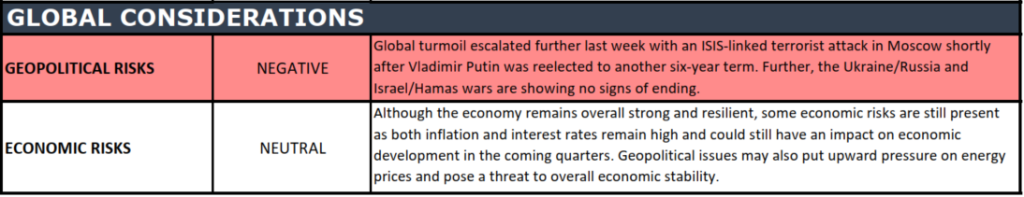
The “Heat Map” is a subjective analysis based upon metrics that VNFA’s investment committee believes are important to financial markets and the economy. The “Heat Map” is designed for informational purposes only and is not intended for use as a basis for investment decisions.
Quote of the Week
“Spring: a lovely reminder of how beautiful change can truly be.” — Tracy McMillan.
Current Market Observations
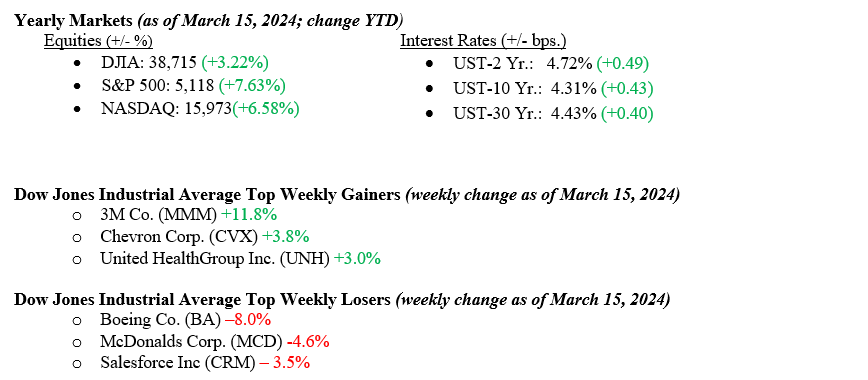
Last week marked the second week of negative returns in the equity markets, albeit modestly negative, especially given the strong price rally we have seen thus far in 2024. Dow Jones Industrial Average fell –0.02%, The S&P 500 Index fell –0.13%, and the NASDAQ fell –0.70%. Equity markets sold off as two inflation reports (CPI (Consumer Price Index) and PPI (Producer Price Index)) showed numbers slightly higher than economists had predicted, leading investors to speculate that interest rates would remain higher for longer and that rate cuts were farther off than predicted as well. We at Valley National Financial Advisors have pointed to June 2024 as the earlier point at which the Fed would start to cut interest rates, and we are sticking with that projection. The 10-year U.S. Treasury bond yield rose 22 basis points last week to close at 4.31%.
U.S. Economy
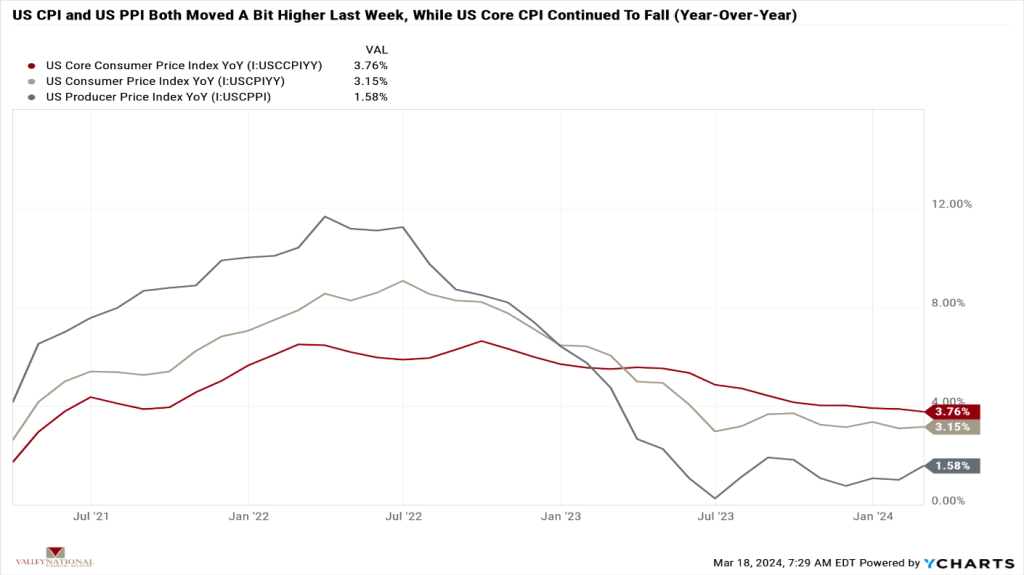
As mentioned above, two inflation reports showed that inflationary pressures are sticking around longer than economists thought. The U.S. CPI and U.S. PPI showed modest moves higher on a year-over-year basis, but the U.S. Core CPI continues to fall slowly but steadily. See Chart 1 below from Valley National Financial Advisors and Y Charts showing the inflationary trend in the above reports. While sticky inflation may seem like a problem, the path to the Fed’s 2% inflation target was never going to be linear; rather, it would be gradual and lumpy, and that is what we are seeing as higher interest rates continue to combat pandemic-related inflationary pressures. Fed Chairman Jay Powell and the FOMC will meet this week to determine interest rate policy for the next several months. We expect rates to remain unchanged, with the Fed Funds Rate at 5.50%. After the meeting, Chairman Powell’s press conference will give us some needed direction and timing on the future path of rates and potential cuts.
Policy and Politics
Shockingly, Vladimir Putin was re-elected to a third term as President of Russia. In a media-staged election, Mr. Putin secured 78% of the vote and will be Russia’s leader until at least 2030. Sadly, we do not expect an end to the Ukraine/Russia War as Putin will regard this “victory” as proof that his war efforts are the correct path for Russia to be taking. Global turmoil and conflict continue in Israel and Haiti, with neither region showing a cessation in troubles. Lastly, the U.S. Senate will take up a bill that the U.S. House passed last week where the massively popular app TikTok must be sold off by Chinese company Byte Dance or risk being banned in the U.S. Lobbyists for TikTok and competitor Meta are pouring money into Washington as each tries to pressure Congress for action in either direction.
What to Watch This Week
- Target Fed Funds (Upper Limit) released 3/20 current 5.50%
- U.S. Initial Claims for Unemployment Insurance week of March 16, released 3/21, prior 209,000.
- U.S. Existing Home Sales Monthly for Feb ’24, released 3/21, prior 4.00M
- 30-year Mortgage Rate for the week of March 21, released 3/21, prior 6.74%
Our weekly objective in writing The Weekly Commentary is to inform and educate our readers about the markets, economy, and risks. Of the three, risk is most important to us as it is the hardest to quantify and use when adjusting investment portfolios. Lately, we have struggled to find serious market risks or continued economic growth. Important sectors of the economy are running nicely: consumer, banks, corporate EPS, and housing; all the while, labor remains healthy, with a national employment rate of 3.9%. We expect the Fed to remain on hold as inflation remains stubbornly sticky and is not yet at 2.00%. Watch the Fed and listen to Chair Powell’s message. Please contact your advisor at Valley National Financial Advisors with any questions.
From the Pros… VIDEO
Did you miss last week’s Q&A video? Get to know our new Director of Research & Investments, Christopher Holland, with our CIO, William Henderson.
“Your Financial Choices” Radio
Tune in Wednesday, 6 PM, “Your Financial Choices” on WDIY 88.1 FM. Laurie will be discussing: Inheriting Something? What should you know?
Questions can be submitted to yourfinancialchoices.com before the live show. Recordings of past shows are available to listen to or download at yourfinancialchoices.com and wdiy.org.
Did you miss the last show, Listeners’ Tax Questions? Listen Here