
THE NUMBERS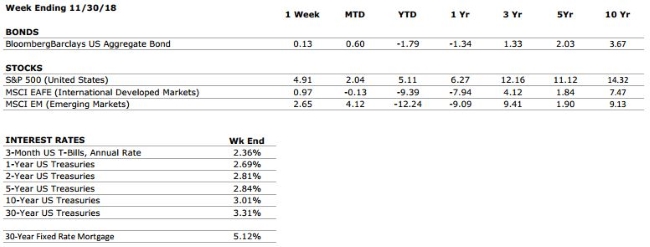
Sources: Index Returns: Morningstar Workstation. Past performance is no guarantee of future results. Indices are unmanaged and cannot be invested into directly. Three, five and ten year returns are annualized excluding dividends. Interest Rates: Federal Reserve, Freddie Mac
US ECONOMIC HEAT MAP
The health of the US economy is a key driver of long-term returns in the stock market. Below, we grade 5 key economic conditions that we believe are of particular importance to investors.
|
CONSUMER SPENDING |
A+ |
Consumer confidence is near all time highs with recent tax reform providing further support. We are anticipating a strong holiday shopping season. |
|
FED POLICIES |
C- |
Despite recent comments from Fed Chairman Jerome Powell that rates are getting closer to “neutral”, we expect the Federal Reserve to raise interest rates one more time at its December meeting. Rising interest rates tend to reduce economic growth potential and can lead to repricing of income producing assets. |
|
BUSINESS PROFITABILITY |
B+ |
We have downgraded our Business Profitability grade to B+. Corporate earnings remain strong, but we anticipate earnings growth will taper off in 2019. We are also beginning to see a higher number of companies reducing forward earnings guidance, a sign that earnings growth may have reached its peak in 2018. |
|
EMPLOYMENT |
A+ |
The US economy added 255,000 new jobs in October, significantly more than the consensus forecast. For six months now, there have been more job openings available in the economy than there are unemployed workers to fill them. |
|
INFLATION |
B |
Inflation is often a sign of “tightening” in the economy, and can be a signal that growth is peaking. The inflation rate remains benign at this time, but we see the potential for an increase moving forward. This metric deserves our attention. |
|
OTHER CONCERNS |
||
|
INTERNATIONAL RISKS |
5 |
The above ratings assume no international crisis. On a scale of 1 to 10 with 10 being the highest level of crisis, we rate these international risks collectively as a 5. These risks deserve our ongoing attention. |
The “Heat Map” is a subjective analysis based upon metrics that VNFA’s investment committee believes are important to financial markets and the economy. The “Heat Map” is designed for informational purposes only and is not intended for use as a basis for investment decisions.