Today is Giving Tuesday. According to GivingTuesday.org, Giving Tuesday is a global generosity movement encouraging giving and the celebration of generosity. Giving Tuesday was originally created in 2012 as a simple idea: a day that encourages people to do good, but that idea has grown into more than just one day. Learn more about giving Tuesday, visit the Giving Tuesday website to get more information.
Monthly Archives: November 2022
Current Market Observations
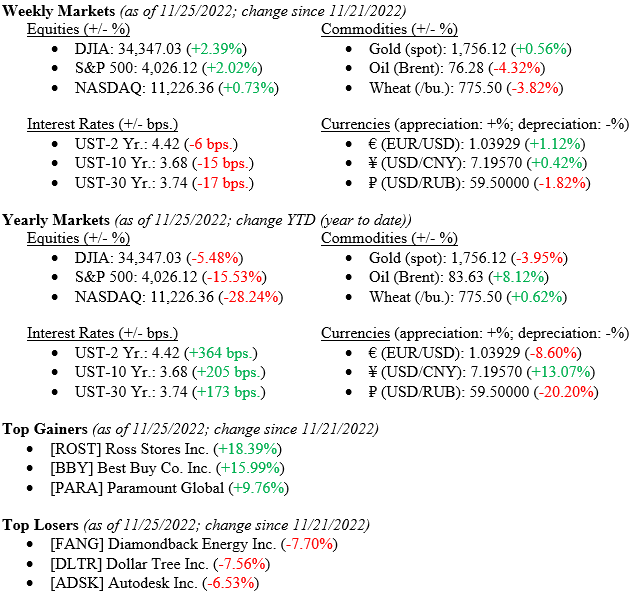
Equity markets posted gains across all three major indexes with the Dow Jones Industrial Average once again leading the way with a +2.39% gain for the week. The S&P 500 Index rose by +2.02% and the tech-heavy NASDAQ, made up of stocks that historically favor low interest rates, rose by only +0.73%. Interest rates fell last week when the minutes of the November 2022 FOMC (Federal Open Markets Committee) meeting indicated policy makers had agreed that a “slowing in the pace of future interest rates would soon be appropriate.” The 10-Year U.S. Treasury note fell by 15 basis points to close the week at 3.68%. Lastly, as we discussed last week, oil, a key economic component and critical ingredient in industrial production, fell to $76.28 for a barrel of Brent crude oil. China COVID-19 lockdowns and related slowing economic conditions in China contributed to oil’s falling price.
Global Economy
As mentioned above, the aggressive COVID-19 lockdowns in China are reverberating across the global economy impacting both the supply and demand components. On an inflationary front, China’s lessening demand for industrial products like oil and rare earth elements used in the production of batteries and solar panels, will certainly aid the global efforts to combat inflation. (See Chart 1 below from Valley National and Y Charts showing the price of oil year-to-date 2022). However, China is a key supplier of goods such as iPhones, TVs and of course, solar panels all of which remain in high demand globally. The news from China about social unrest and protests in several major cities including Beijing due to their aggressive zero-COVID policy weighs heavily on the timing of China’s eventual emergence from the pandemic.

COVID lockdowns may seem like a “China Problem,” but China currently remains the crossroads for the global supply chain and any unrest in their supply chain will percolate through the world’s economy as we saw in 2020-21. However, many countries, importantly the United States, learned from this event and have begun “on-shoring” their production. For example, Intel is building a $20 billion chip manufacturing facility in Ohio and Ford is building a $5.6 billion battery and vehicle manufacturing campus in Tennessee. We believe that investment in U.S. manufacturing is critical to the future of growth and stability of our economy, and that this wave of internal investment and innovation is just starting.
Policy and Politics
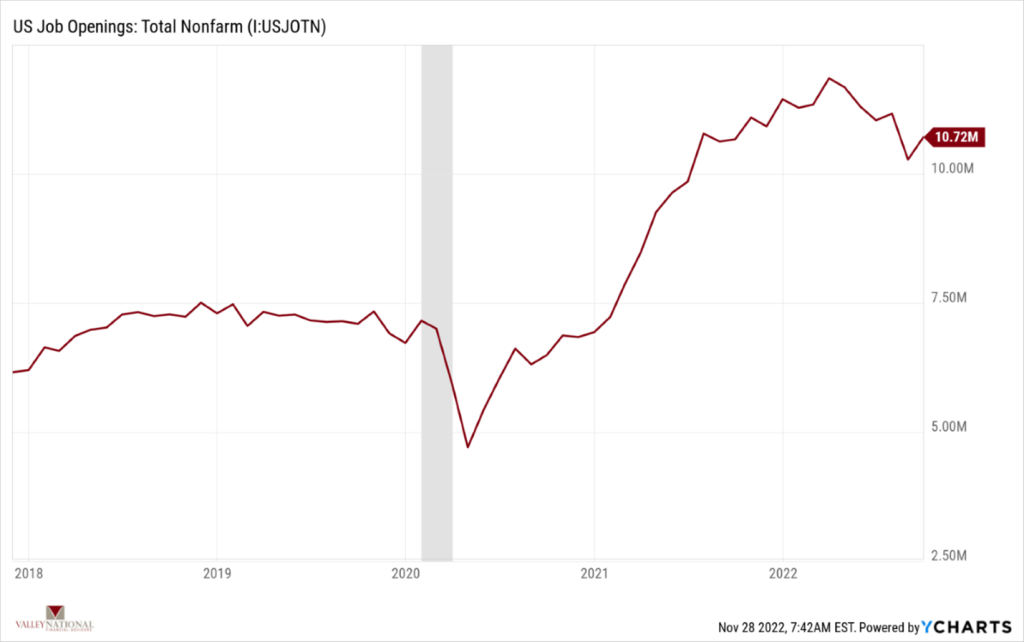
This week, the Bureau of Labor Statistics releases the U.S. Job Openings figure for October 2022 (gathered from the Job Openings and Labor Turnover Survey – JOLTS). The September figure showed 10.72 million job openings, an increase from August of 10.28 million openings. (See Chart 2 below from Valley National Financial Advisors and Y Charts). The so-called JOLTS survey is known to be a closely watched data point by the FOMC because it is an important measure of the tightness in the job market. A softening labor market would certainly help to ease inflationary pressures such as wage growth.
What to Watch
- While not an economic indicator, the unraveling of the FTX cryptocurrency mess continues to hold a pall over the entire cryptocurrency market as uncertainty abounds. Markets hate uncertainty.
- Case-Shiller Composite 20 Home Price Index Year-over-Year for September 2022 released 11/29/22 (prior +13.11%)
- U.S. Job Openings: Nonfarm for October 2022, released 11/30/22 (prior 10.72M)
- U.S. PCE (Personal Consumption Expenditures) Price Index Year-over-Year for October 2022, released 12/1/22 (prior +6.24%)
Summary
While problems remain in the economy, including such risks as China-influenced supply disruptions and inflation, we are seeing seeds of a turnaround and a lessening in inflationary pressures such as falling oil prices. Meanwhile, the Dow Jones Industrial Average closing at 34,347 as of 11/25/22, has rallied +20% since bottoming on September 29, 2022, at 28,726. Stock markets have historically been excellent predictors of future economic results. Further, the VIX (the CBOE Volatility Index) fell again last week to 20.4, down from a recent high of 33.6 on October 11, 2022. The VIX is used as a barometer for fear and uncertainty in the future markets. As we mentioned last week, the time between Thanksgiving and Christmas is typically a quiet, calm time on Wall Street and the VIX is certainly sending that message. We would love to simply say keep calm—but rather we say keep vigilant and focus on matters that grow wealth over extended periods of time.
The Numbers & “Heat Map”
THE NUMBERS
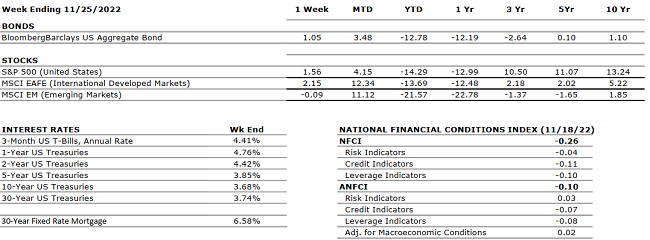 The Sources: Index Returns: Morningstar Workstation. Past performance is no guarantee of future results. Indices are unmanaged and cannot be invested into directly. Three, five and ten year returns are annualized. Interest Rates: Federal Reserve, Mortgage Bankers Association.
MARKET HEAT MAP
The health of the economy is a key driver of long-term returns in the stock market. Below, we assess the key economic conditions that we believe are of particular importance to investors.
|
US ECONOMY |
||
|
CONSUMER HEALTH |
NEUTRAL |
Real GDP for Q2 2022 decreased at an annual rate of 0.6% (up from the first estimate of -0.9%) marking the second consecutive quarter of declining GDP. The advance estimate for Q3 2022 shows Real GDP to have increased by an annual rate of 2.6%. |
|
CORPORATE EARNINGS |
NEUTRAL |
The estimated growth rate for Q3 2022 is 2.2%, which was adjusted downward from 9.8% in June and 2.4% a month ago. So far, with 94% of S&P500 companies reporting actual results, 69% of them reported a positive EPS surprise and 71% beat revenue expectations. |
|
EMPLOYMENT |
NEUTRAL |
U.S. Nonfarm Payrolls for October 2022 increased by 261,000 and the unemployment rate rose from 3.5% in September to 3.7%. October’s gains were broad-based but primarily driven by manufacturing and healthcare sectors which added 32,000 and 53,000 jobs respectively. |
|
INFLATION |
NEGATIVE |
The annual inflation rate in the U.S. increased by 7.7% for October 2022 compared to the expected 7.9% — showing some signs of deceleration. Core CPI was also reported below expectations at 6.3% versus the estimated 6.5%. Shelter, food, and gasoline remain the main contributors to elevated inflation. |
|
FISCAL POLICY |
NEUTRAL |
Senator Manchin and Majority Leader Schumer reached an agreement on the latest tax and energy bill with incentives for green energy, electric cars, and conversely oil & gas companies for exploration. No changes in private equity taxes or higher tax rates for the very wealthy were enacted. The bill has been officially passed by the Senate. President Biden announced student loan forgiveness of up to $20,000 subject to income limitations. |
|
MONETARY POLICY |
NEGATIVE |
The Fed approved a fourth consecutive 75 bps hike earlier this month which took its target range to 3.75%-4.00% – the highest it has been since 2008. The Fed hinted at potentially reducing the magnitude of future rate increases from 75 to 50 bps but also mentioned the possibility of a new higher target range closer to 5%. |
|
GLOBAL CONSIDERATIONS |
||
|
GEOPOLITICAL RISKS |
NEGATIVE |
Russia held controversial referendums for the annexation of four Ukrainian regions and the Russian Parliament unanimously recognized these regions as part of Russia. Ukraine and Western countries have condemned these actions by Russia by declaring them illegitimate and illegal. Additional sanctions are being imposed on Russia by many countries. |
|
ECONOMIC RISKS |
NEGATIVE |
COVID-19 lockdowns in China are persistent and the ongoing Russian-Ukraine war is causing a major energy crisis in Europe. Gas supplies from Russia to Europe have decreased by 88% over the past year and EU countries have agreed to cut gas usage by 15% as gas prices have more than doubled. The U.S. is now dealing with a major diesel shortage with national reserves at their lowest levels since 1951 and a ban on Russian products that will intensify the issue. |
The “Heat Map” is a subjective analysis based upon metrics that VNFA’s investment committee believes are important to financial markets and the economy. The “Heat Map” is designed for informational purposes only and is not intended for use as a basis for investment decisions.
Quote of the Week
“The key to success is to focus on goals, not obstacles” -Unknown
“Your Financial Choices”
Tune in Wednesday, 6 PM “Your Financial Choices” on WDIY 88.1FM. Laurie will be discussing: Financial Situations With Your Family.
Questions can be submitted at yourfinancialchoices.com during or in advance of the live show. Recordings of past shows are available to listen or download at both yourfinancialchoices.com and wdiy.org.
VNFA NEWS
Team VNFA is excited contribute to the 2022 Volunteer Center Holiday Hope Chests. This will the 22nd year celebrating the delivering of joy and laughter with their shoeboxes to over 8,000 youth here in our community. Every box donated makes a difference in a child’s life. The Volunteer Center makes it easy for anyone that wants to participate and bring extra smiles to kids in our community. Team VNFA is happy to share a little magic this year. If you are interested in being part of this amazing cause visit the Volunteer Center of the Lehigh Valley.
From the Pros… VIDEO
Chief Investment Officer, William Henderson, talks about Diverging Index Returns.
Current Market Observations
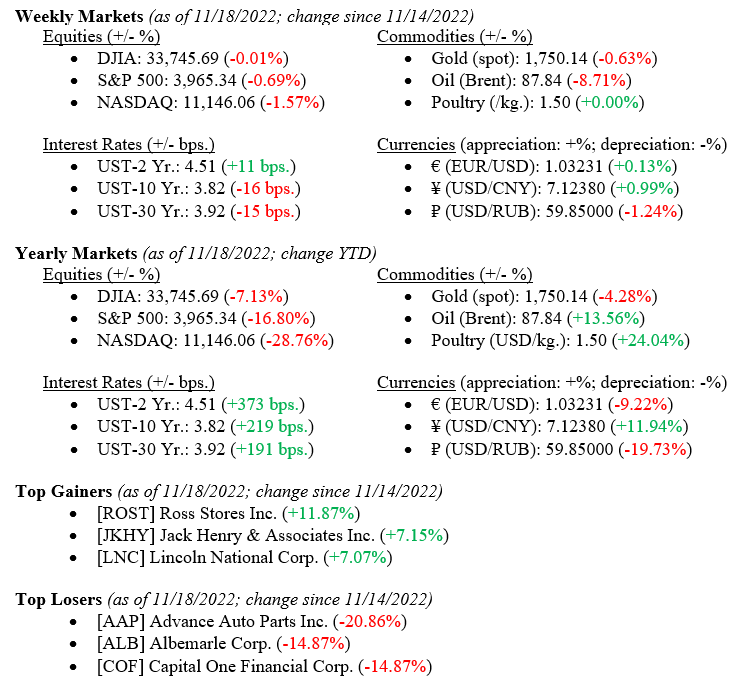
Equities rallied early in the week after an inflation report (U.S. Core PPI Year Over Year for October 2022 dropped to +6.68% from +7.12% in September 2022). However, the rally was brief as concerns about the pace of future interest rate hikes by the Fed, China “Lockdown” issues and retail sales data to be released this week renewed concerns of a recession in 2023. For the week, The Dow Jones Industrial Average was unchanged, the S&P 500 Index fell –0.69% and the tech-heavy NASDAQ fell by –1.57%. We review U.S. Treasury yields spreads and inflation data, including the drop in crude oil prices, below.
Global Economy
Last week’s inflation report (Core PPI) showed a modest drop in prices that producers are paying for goods and services. A major component for production is oil (consumers are equally impacted by oil prices). West Texas Intermediate crude oil continues to fall each week. Chart 1 from Valley National Financial Advisors and Y Charts showing WTI prices since 2008 Oil prices have come down dramatically since the spring of 2022 and are nearing the levels we saw after the 2008-09 recession when modest growth was the norm. Recall that petroleum products and byproducts are in every industry (agriculture for fertilizer production), transportation (planes, trains & automobiles (timely reference), and plastics of every kind, so lower prices in oil eventually translates to lower prices in everything else.

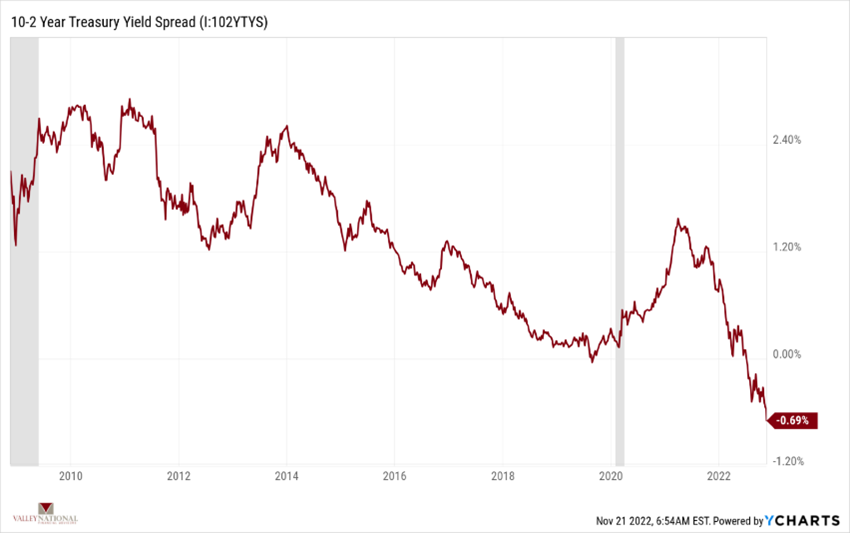
Industry experts are still calling for a modest recession in 2023. The September 2022 reading showed a 23% chance of a recession in 2023. This reading is higher than the long-term average of 14% and solely based on the spread between 10-year and 2-year US Treasury Notes. Certainly, this indicator is screaming recession in 2023. Chart 2 by Valley National Financial Advisors and Y Charts showing the spread between 10-year and 2-year US Treasury Notes. A negative spread, where the 2-year yield is higher than the 10-year yield, also called an inverted yield curve, has historically precipitated a recession. However, the start, depth, and duration of said recession is always unknown. At this point, economists are still calling for a brief and shallow recession for the U.S. and Eurozone in 2023.
Policy and Politics
Thankfully, Washington is in recess, so we are free from any new or intrusive regulations or laws. The massive $32 billion FTX bankruptcy and obvious fraud, if not actual criminal activity surrounding this cryptocurrency fallout must produce come form or government involvement. Investors in this space, after losing billions, might now wish for the Securities and Exchange Commission, FDIC or other oversight group to protect their investments.
What to Watch
- U.S. Durable Goods New Orders for October 2022, released 11/23 (Previous +0.36%)
- U.S. Claims for Unemployment week of November 19, 2022, released 11/23 (Previous 222,000)
- U.S. Index of Consumer Sentiment November 2022 reading, released 11/23 (Previous 54.70)
The Thanksgiving Holiday week marks the start of the holiday season on Wall Street. Traders sure up balance sheets and portfolio manager window dress their portfolios adding marquee names to their holdings. It will certainly cost more to put on the family Thanksgiving Feast this year. The American Farm Bureau Federation estimates that a classic Thanksgiving feast for 10 would cost $64.05, or $6.41 a person, up 20% from last year’s average of $53.31. That includes turkey, stuffing, sweet potatoes, rolls with butter, peas, cranberries, a vegetable tray, pumpkin pie with whipped cream, coffee, and milk, “with plenty for leftovers.” For $6.41 a person, Americans get to spend time with friends and family and share stories of happiness and Thanksgiving—to us, $6.41 seems like a bargain. Happy Thanksgiving.
The Numbers & “Heat Map”
THE NUMBERS
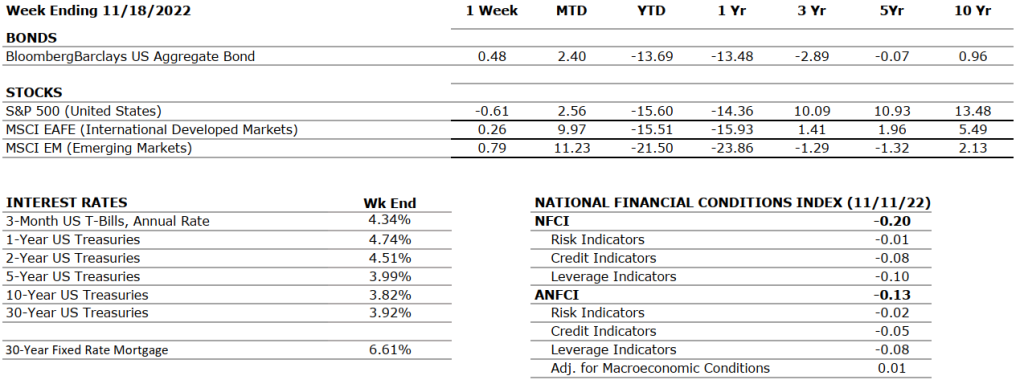 The Sources: Index Returns: Morningstar Workstation. Past performance is no guarantee of future results. Indices are unmanaged and cannot be invested into directly. Three, five and ten year returns are annualized. Interest Rates: Federal Reserve, Mortgage Bankers Association.
MARKET HEAT MAP
The health of the economy is a key driver of long-term returns in the stock market. Below, we assess the key economic conditions that we believe are of particular importance to investors.
|
US ECONOMY |
||
|
CONSUMER HEALTH |
NEUTRAL | Real GDP for Q2 2022 decreased at an annual rate of 0.6% (up from the first estimate of -0.9%) marking the second consecutive quarter of declining GDP. The advance estimate for Q3 2022 shows Real GDP to have increased by an annual rate of 2.6%. |
|
CORPORATE EARNINGS |
NEUTRAL | The estimated growth rate for Q3 2022 is 2.2%, which was adjusted downward from 9.8% in June and 2.4% a month ago. So far, with 94% of S&P500 companies reporting actual results, 69% of them reported a positive EPS surprise and 71% beat revenue expectations. |
|
EMPLOYMENT |
NEUTRAL | U.S. Nonfarm Payrolls for October 2022 increased by 261,000 and the unemployment rate rose from 3.5% in September to 3.7%. October’s gains were broad-based but primarily driven by manufacturing and healthcare sectors which added 32,000 and 53,000 jobs respectively. |
|
INFLATION |
NEGATIVE | The annual inflation rate in the U.S. increased by 7.7% for October 2022 compared to the expected 7.9% — showing some signs of deceleration. Core CPI was also reported below expectations at 6.3% versus the estimated 6.5%. Shelter, food, and gasoline remain the main contributors to elevated inflation. |
|
FISCAL POLICY |
NEUTRAL | Senator Manchin and Majority Leader Schumer reached an agreement on the latest tax and energy bill with incentives for green energy, electric cars, and conversely oil & gas companies for exploration. No changes in private equity taxes or higher tax rates for the very wealthy were enacted. The bill has been officially passed by the Senate. President Biden announced student loan forgiveness of up to $20,000 subject to income limitations. |
|
MONETARY POLICY |
NEGATIVE | The Fed approved a fourth consecutive 75 bps hike earlier this month which took its target range to 3.75%-4.00% – the highest it has been since 2008. The Fed hinted at potentially reducing the magnitude of future rate increases from 75 to 50 bps but also mentioned the possibility of a new higher target range closer to 5%. |
|
GLOBAL CONSIDERATIONS |
||
| GEOPOLITICAL RISKS | NEGATIVE | Russia held controversial referendums for the annexation of four Ukrainian regions and the Russian Parliament unanimously recognized these regions as part of Russia. Ukraine and Western countries have condemned these actions by Russia by declaring them illegitimate and illegal. Additional sanctions are being imposed on Russia by many countries. |
|
ECONOMIC RISKS |
NEGATIVE | COVID-19 lockdowns in China are persistent and the ongoing Russian-Ukraine war is causing a major energy crisis in Europe. Gas supplies from Russia to Europe have decreased by 88% over the past year and EU countries have agreed to cut gas usage by 15% as gas prices have more than doubled. The U.S. is now dealing with a major diesel shortage with national reserves at their lowest levels since 1951 and a ban on Russian products that will intensify the issue. |
The “Heat Map” is a subjective analysis based upon metrics that VNFA’s investment committee believes are important to financial markets and the economy. The “Heat Map” is designed for informational purposes only and is not intended for use as a basis for investment decisions.
Quote of the Week
“Thankfulness is the quickest path to joy.” – Jefferson Bethke

