By: Chief Investment Officer, William Henderson
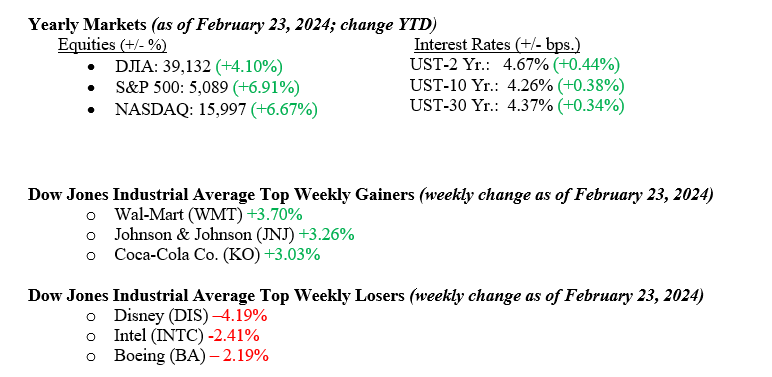
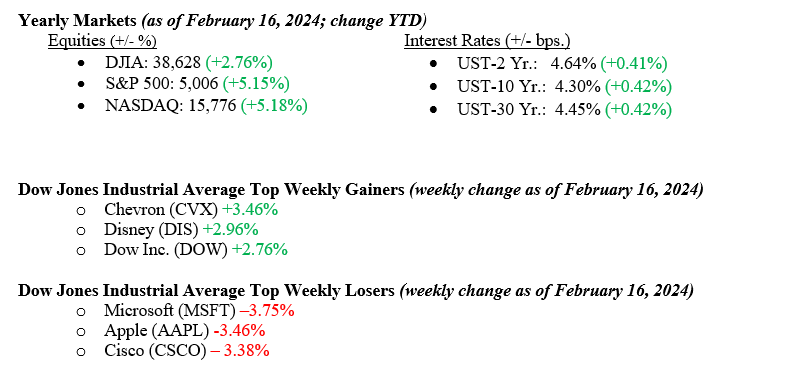
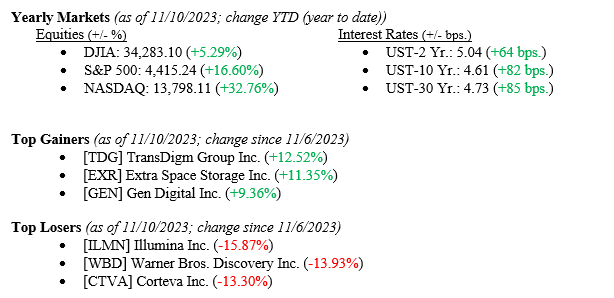
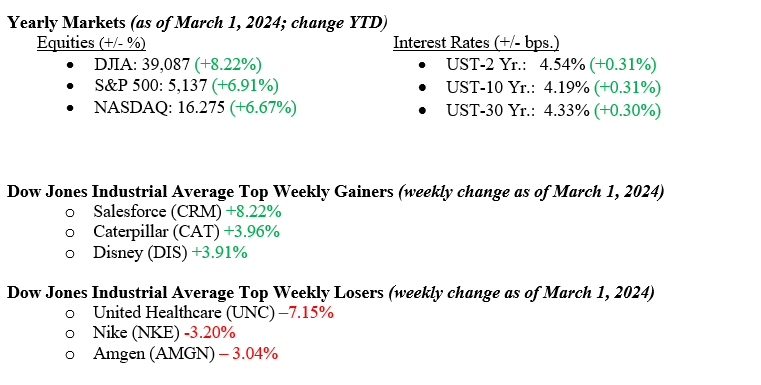
Equity markets were mixed last week, with two of the three major indexes reporting positive results and only the Dow Jones Industrial Average falling for the week. The S&P 500 Index rose +0.95%, the NASDAQ rose +1.74%, while the Dow Jones Industrial Average fell –0.11%. Critically important to a needed broadening in equity returns, the Russell 2000 Index of Small Capitalization stocks rose +3.00%. We do not typically report on the Russell 2000, but this week’s move higher has put some breadth into the market rather than keeping returns concentrated in the “Magnificent 7.” Concentrated markets tend to rise and fall quickly and are usually based on a small piece of information rather than sound fundamentals. Fixed-income markets were quiet last week as traders and markets have accepted that interest rate cuts by the Federal Reserve are further off than previously thought. The 10-year U.S. Treasury bond yield fell seven basis points to close the week at 4.19%.
U.S. Economy
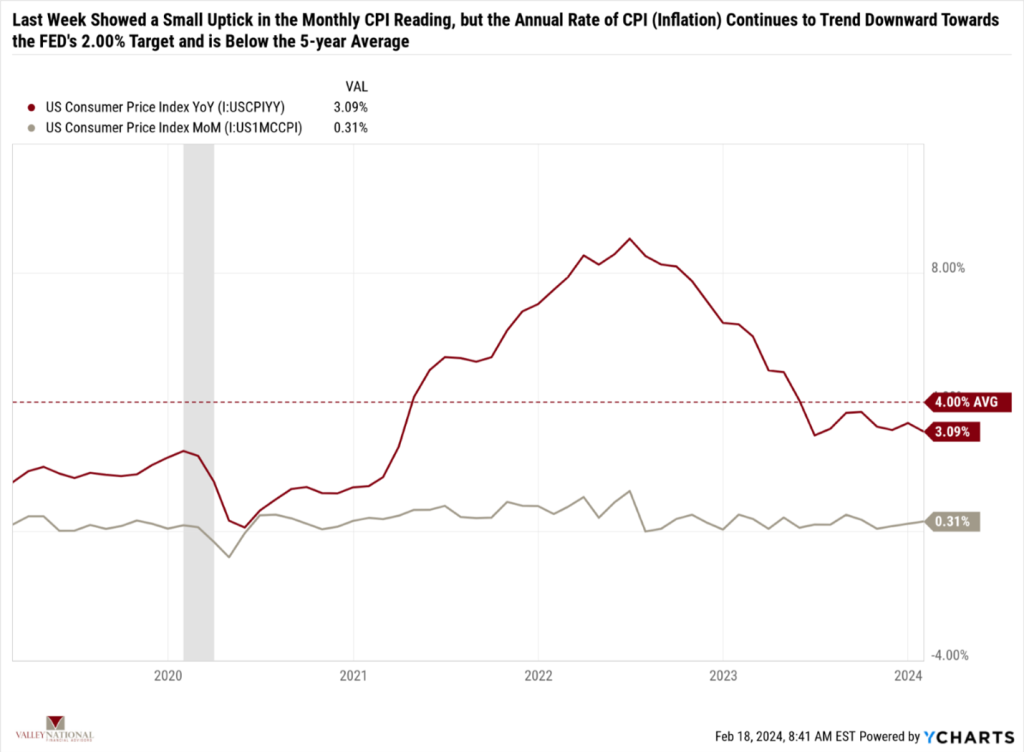
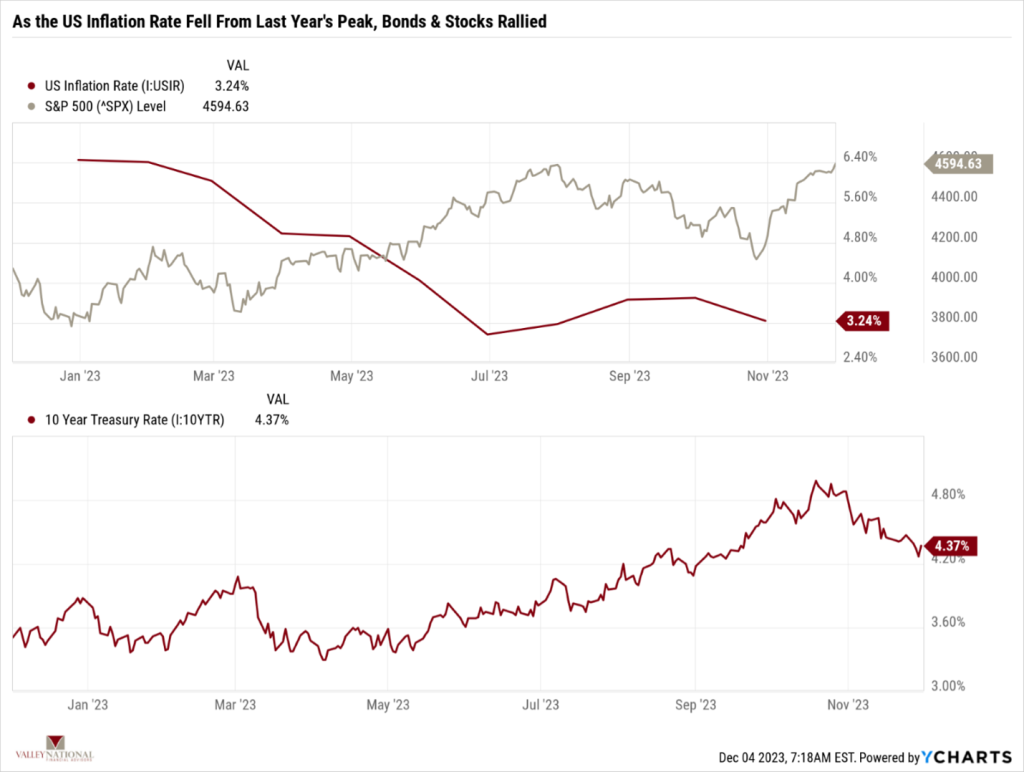
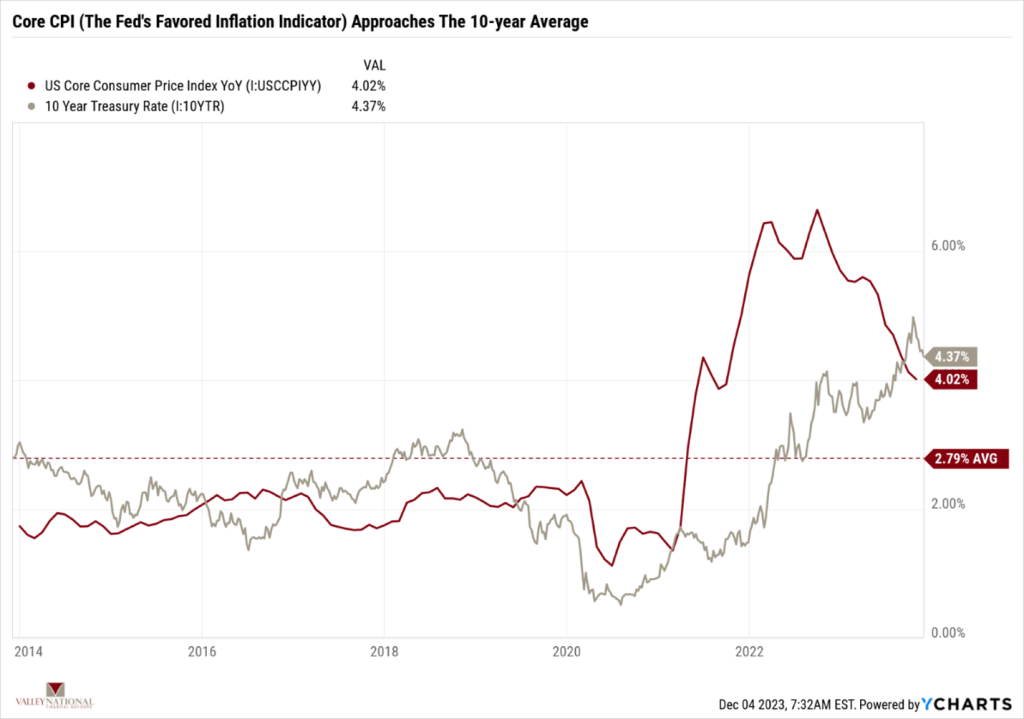
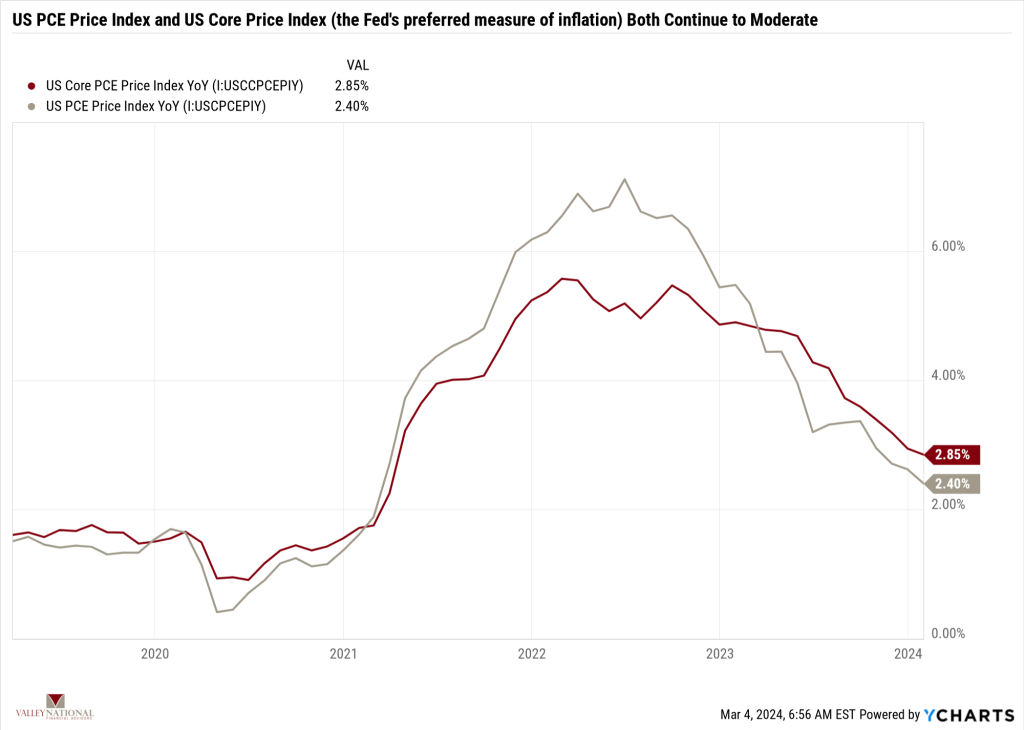
Last week’s inflation data showed that prices on consumer goods continue to fall. See Chart 1 from Valley National Financial Advisors and Y Charts showing U.S. Core PCE (Personal Consumption Expenditures) and US PCE YoY. The recent U.S. Core reading is at 2.85%, compared with 2.94% last month and 4.90% last year. This recent reading is lower than the long-term average of 3.24%. While the U.S. Inflation Rate is currently at 3.09%, below the Fed’s target of 2.00%, Fed Chairman Jay Powell has stated that interest rates could move before the inflation rate reaches their target. A Fed pivot (moving from raising rates to cutting rates) will help broaden out equity returns beyond the “Magnificent 7” because small-cap and mid-cap U.S. companies tend to be more interest rate sensitive than large-cap companies.
Corporate profits continue to be strong, and forward-looking estimates suggest we will see profit growth over the next year. Thus far, 90% of S&P 500 Index companies have reported 4th quarter earnings, and according to Bloomberg, revenue growth was +3.8%, while earnings growth was a healthy +7.5%. While much of the growth was attributable to the “Magnificent 7,” if the Fed does eventually pivot on interest rates (we expect not until the second half of 2024), cyclical sectors of the economy will benefit. Thus, economic growth will continue at a robust pace.
Policy and Politics
March 5th is Super Tuesday, with 15 U.S. states holding primaries on the same day. We expect that the 2024 U.S. presidential primary race will be determined after this date, and whether we have Trump v Biden or Haley v Biden, the next 8+ months will be chock full of the nonsense that sadly surrounds major U.S. elections these days. In the meantime, lawmakers have reached a tentative agreement (to be voted on this week) to fund the government, thereby avoiding another embarrassing shutdown.
We continue to watch the saga playing out with New York Community Bank, where last week they restated their previous earnings results and disclosed potential “weaknesses in internal accounting practices” (emphasis ours!). Banks can be fragile places because confidence in management means confidence in where one places their money for safekeeping. We are confident that the Federal Reserve Bank, the FDIC, and the Treasury know NYCB’s problems and will provide needed guidance and assistance.
What to Watch This Week
- U.S. Job Openings: Total Nonfarm, released 3/6/24, prior 9.026M
- U.S. Initial Claims for Unemployment Ins. for the week of 3/2/24, released 3/7/24, prior 215.000.
- U.S. Labor Force Participation Rate for Feb 2024, released 3/8/24, prior 62.5%
- U.S. Unemployment Rate for Feb 2024, released 3/8/24, prior 3.7%
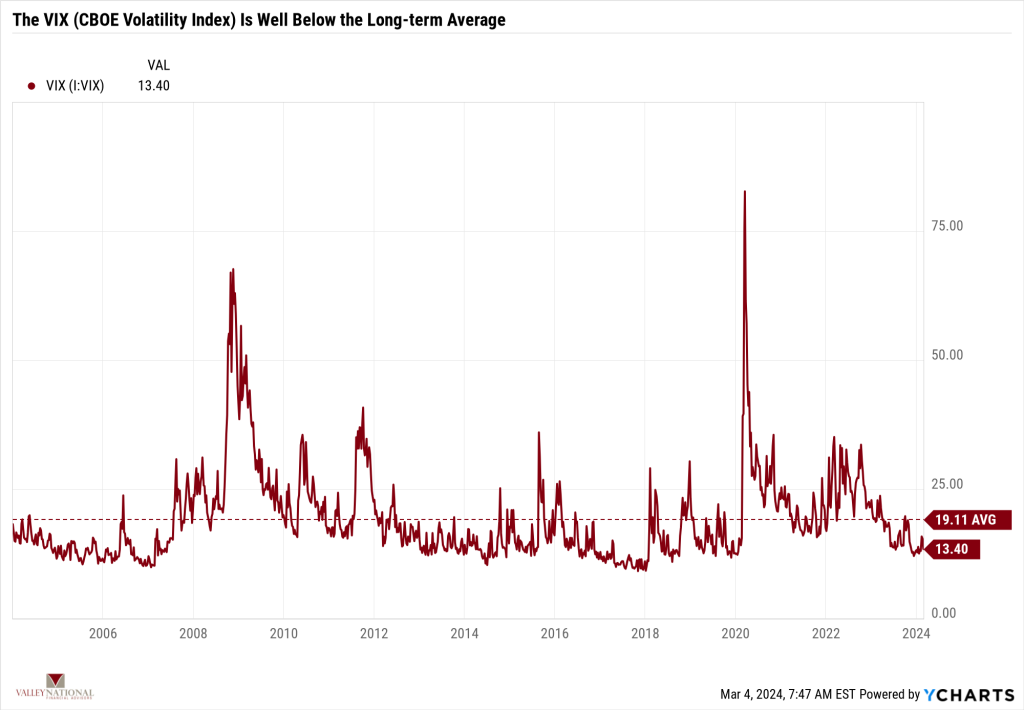
Market volatility remains sanguine, and other than the potential for a government shutdown, news from Washington DC has been muted. Global turmoil exists with Israel/Hamas and Ukraine/Russia, but true market volatility is muted. See Chart 2 below from Valley National Financial Advisors and Y Charts showing the VIX or Volatility Index. The VIX is at 13.40, well below the long-term average of 19.11. Our view on this data point is that true risks to the market, like higher interest rates and a major U.S. economic slowdown or disruption, remain on the sidelines, allowing markets to trade on their own merits.
Among the noise and news, markets continue to set new all-time highs as they efficiently filter out the noise. Low volatility, remaining fiscal stimulus from previous years’ bills (CHIPs Act or Inflation Reduction Act), and growing corporate earnings create real tailwinds for equities. If we get a Fed pivot on interest rates in the second half of 2024, further tailwinds will emerge. It is hard to find unwelcome news these days, but we will keep looking! Reach out to your advisor at Valley National Financial Advisors for help or questions.