#TeamVNFA held its second Dip Bowl contest to celebrate the upcoming Super Bowl. The Jalapeno Popper Dip came in first place!! Congratulations to our winner, Ashley Santiago! 🌶️🏆
This year’s contenders presented an array of phenomenal dips, including a Jalapeno Popper Dip, Broccoli Cheddar Dip, Vegetarian White Bean Spicy Buffalo Dip, Buffalo Chicken Dip, Street Corn and Chicken Dip, Cheesy Mashed Potato & Chorizo Dip, and an amazing Ranch Dip. For those with a sweet tooth, our spread also featured delightful treats like homemade Rice Krispies Treats, Brownies, Pumpkin Tres Leche, and Chocolate Cream Pie. The competition was fierce, and the flavors were unbeatable! #SuperBowlCelebration #DipBowlChampion
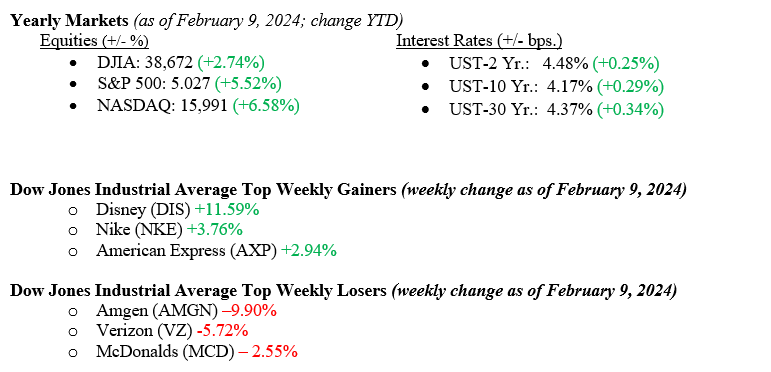
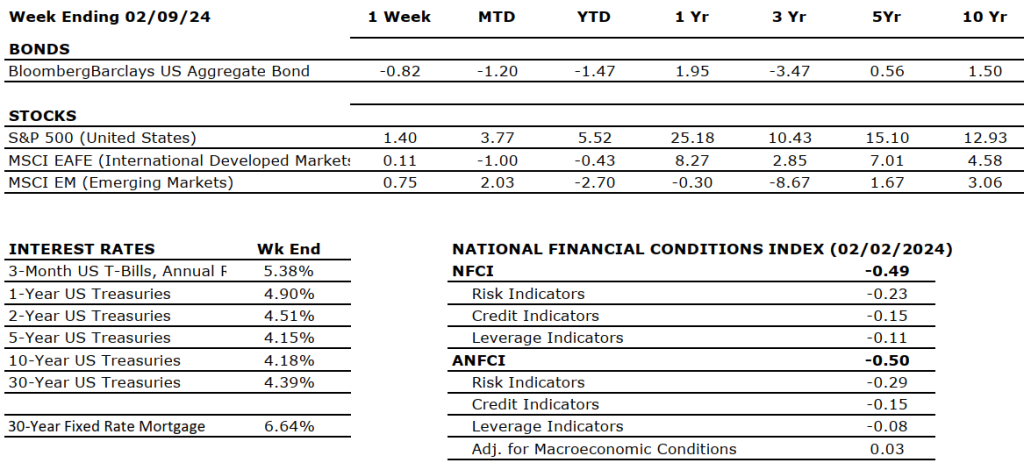
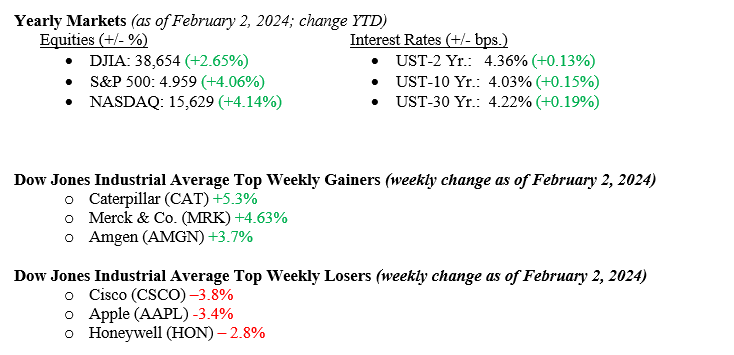
The verdict is still out on which city is happier at this point: Kansas City for clinching another Super Bowl victory or Wall Street for closing the S&P 500 Index over 5,000 for the first time in history. Given the historic volatility offered up by Wall Street, we would take the permanence of the Super Bowl victory. However, last week proved to be another winning week for the markets, with each major market index closing higher. The Dow Jones Industrial Average was barely higher by +0.04%, while the S&P 500 Index was +1.37% and the NASDAQ higher by +2.44%. Keeping with the Super Bowl theme here, equity markets seem much more content thinking about wins than losses, and the thoughts of a recession have now moved to the way back burner. Readers of The Weekly Commentary know we have believed in the strength of the US economy for well over a year now and still believe we are in a growth phase, albeit potentially trending downward, but slowly. Fixed income markets performed poorly last week, with the 10-year U.S. Treasury bond yield increasing by 14 basis points to 4.17%.
U.S. Economy
As mentioned above, the S&P 500 Index, widely understood to be a fair gauge of large capitalization stocks, closed above 5,000 for the first time in history. This is important because it truly shows the strength and resilience of the U.S. economy. See Chart 1 below from Valley National Financial Advisors and Y Charts showing the S&P 500 Index and the U.S. Gross Domestic Product since 1940. Market prognosticators and experts love to talk about the “Wall of Worry” or “the coming recession,” neither of which really matters over the long term, as you can see from the chart. The U.S. consumer, who continues to be gainfully employed, spends prolifically and churns out massive economic activity as a result. Our economy is consumer-driven, and overall, consumers are healthy, cash-rich, eager to spend, shop, and travel. If Punxsutawney Phil is correct and spring comes soon, we should continue to see healthy economic activity in the U.S.
Patrick Mahomes was the Super Bowl LVIII MVP, but the Wall Street MVP is the U.S. Consumer.
Policy and Politics
Washington seems content to flounder and argue rather than pass any meaningful legislation regarding the border crisis or additional aid to Ukraine or Israel. With the presidential election starting to take center stage, we believe Washington will be less likely to pass anything not directly tied to the important government funding bill coming in March. Meanwhile, Fed Chairman Jay Powell is marching to his own drum chorus and staying put on rate cuts at least through March 2024. All the main Fed speakers that were out last week parroted Chairman Powell’s message: “We need to see inflation come down a bit more to make sure we are not cutting rates too soon.” This week, we will see important inflation data that will give the FOMC (Federal Open Market Committee) their sought-after data.
What to Watch This Week
U.S. Core Consumer Price Index YoY for Jan ’24, released 2/13/24, prior 3.90%
U.S. Inflation Rate for Jan ’24, release 2/13/24, prior 3.35%
U.S. Job Openings Total Nonfarm for Jan ’24, release 2/14/24, prior 9.026M
U.S. Core Producer Price Index YoY for Jan ’24, released 2/16/24, prior 1.76%
New records are reached every year whether in sports, industry, or Wall Street. We love to see records broken as much as the next person, but the real story is the one where investors stick to their long-term investment plan thereby building truly generational wealth. There are plenty of reasons to expect equity markets to grow this year but there are always risks. Risk drives returns, and the management of risk over prolonged periods increases returns. The goal of a true investor is to increase returns while managing and limiting risk. Reach out to your financial advisor at Valley National Financial Advisors for assistance.
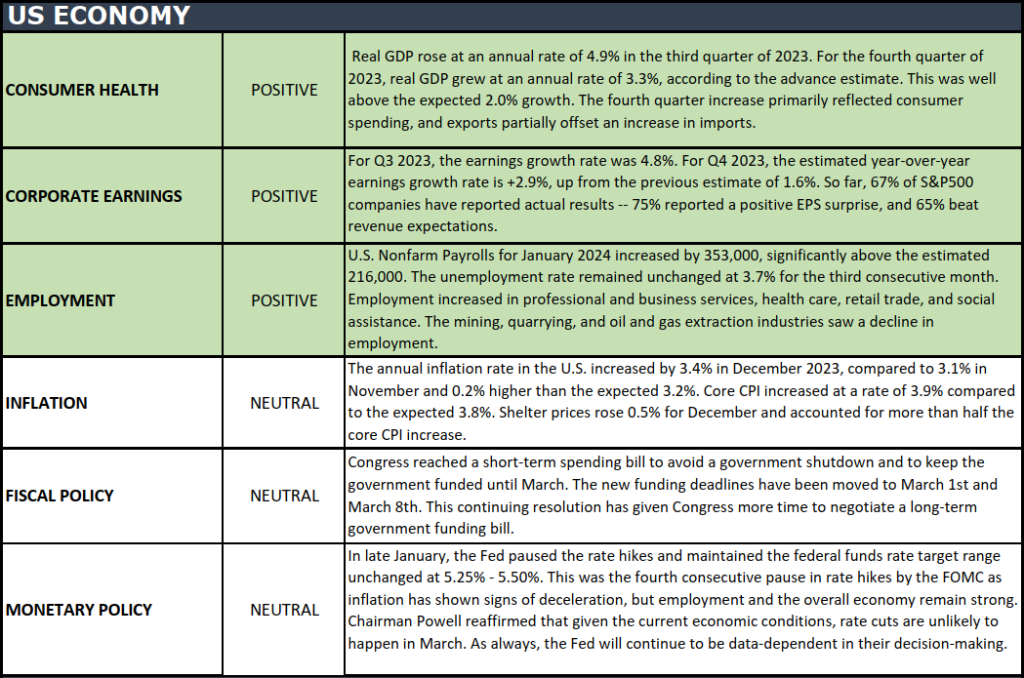
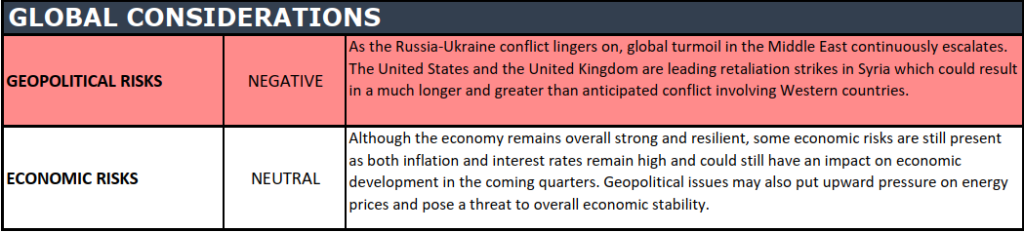
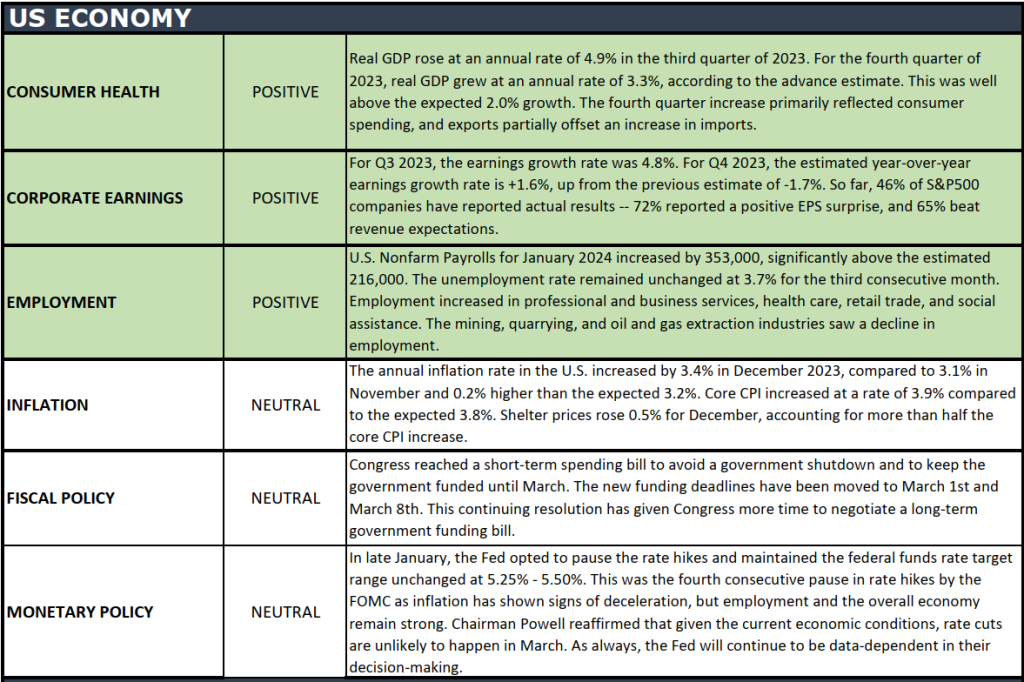
The health of the U.S. economy is a key driver of long-term returns in the stock market. Below, we grade key economic conditions that we believe are of particular importance to investors.
The “Heat Map” is a subjective analysis based upon metrics that VNFA’s investment committee believes are important to financial markets and the economy. The “Heat Map” is designed for informational purposes only and is not intended for use as a basis for investment decisions.
Tune in Wednesday, 6 PM for a pre-recorded “Your Financial Choices” show on WDIY 88.1 FM. Laurie will address questions submitted online during the next live broadcast.
Recordings of past shows are available to listen or download at both yourfinancialchoices.com and wdiy.org.
Last week, we were waiting for three significant events to unfold:
The FOMC (Federal Open Market Committee) meeting results.
EPS announcements of a few mega-tech firms.
Jobs and unemployment data.
We started on Wednesday with Federal Reserve Bank Chairman Jay Powell and the FOMC first announcing no change in interest rates and reaffirming that rate cuts are unlikely to happen at the March 2024 meeting. That news initially poured cold water on the markets, but this was short-lived as upside earnings surprises by META (Facebook parent) and Amazon.com changed the course of the markets for the week as all major indexes ended higher (Dow Jones Industrial Average, +1.4%, S&P 500 Index +1.4%, and the NASDAQ +1.1%). The week ended with more positive news; we saw higher weekly new jobs created, continued low unemployment, and another rise in Consumer Sentiment. The 10-year US Treasury moved lower by 12 basis points to close the week at 4.03%.
U.S. Economy
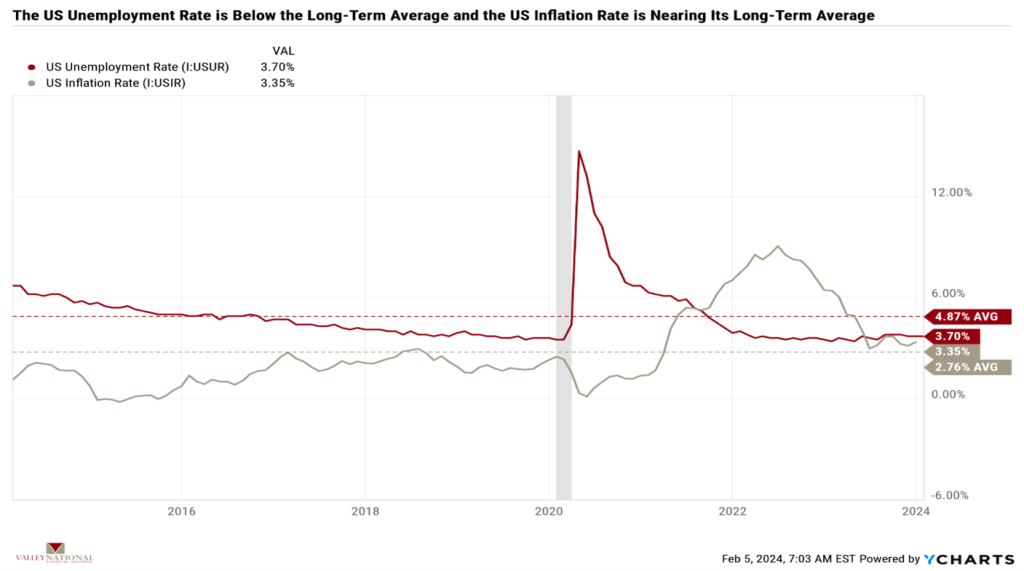
The U.S. economy continues to chug along nicely, confounded most experts and economists. Experts continue to point to the 1970s and 1980s as a guide for what the Fed should do now. 1970 was over 50 years ago, and we did not have iPhones, ChatGPT, or CNBC at our fingertips for data and information flow. We at Valley National Financial Advisors focus instead on the current data right in front of us, which continues to be positive across the board. As mentioned, last week, new jobs created measured 350,000 vs. expectations of +216,000, and the unemployment rate stayed at 3.7%, below the long-term average. See Chart 1 below from Valley National Financial Advisors and Y Charts showing the U.S. Unemployment Rate and the U.S. Inflation Rate. Both are important measures for the Fed as their mandate is “full employment” and “2% inflation.” We are at the employment mandate but only nearing the inflation mandate (3.35%), so to us at Valley National Financial Advisors, it makes sense that Fed Chairman Jay Powell is watching the data and waiting before embarking on an interest rate-cutting path.
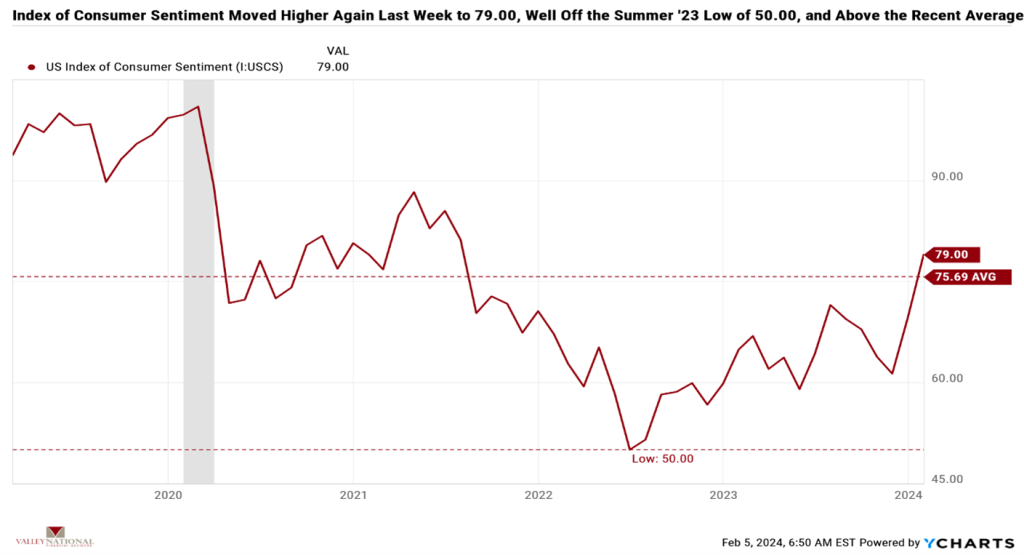
Weekly readers of The Weekly Commentary know that the U.S. economy is 70% consumer-driven, and a healthy, working consumer will continue to consume. Last week, the U.S. Index of Consumer Sentiment (previously called Consumer Confidence) came in at 79.00, well off the 50.00 reading last summer when experts stubbornly predicted a recession. See Chart 2 below from Valley National Financial Advisors and Y Charts. A rising Consumer Sentiment Index displays increased consumer confidence, typically evidenced during expansionary periods. This confidence indicator certainly makes sense to us at Valley National Financial Advisors, as employment opportunities abound and American companies continue to make money, hire, and expand operations, especially within the U.S. borders.
Policy and Politics
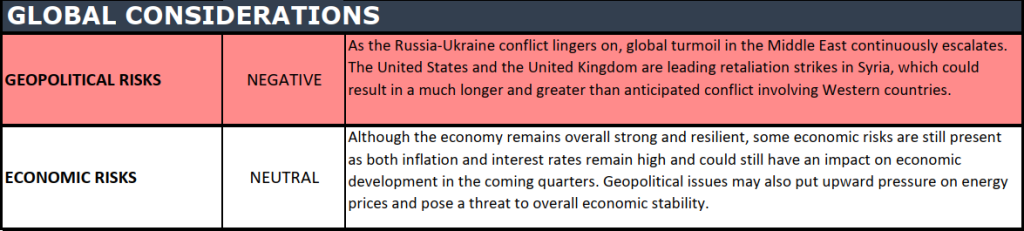
It is a quiet week for Washington, and members of Congress wrangle over a spending bill for aid to Ukraine and Israel and money for border security. These issues will languish, and Washington will eventually do what it does best, which is to spend money. Global turmoil in the Middle East continues, with the United States and the United Kingdom leading retaliation strikes in Syria. We are concerned about this issue and worry that 1) it will last longer than anticipated and 2) spill over into a much greater Middle East conflict.
What to Watch This Week
U.S. Consumer Credit Outstanding for Dec 2023, released 2/7/24, prior $23.75 billion.
U.S. Initial Claims for Unemployment Insurance for the week of Feb 3, released 2/8/24, prior 224,000.
30 Year Mortgage Rate for the week of Feb 8, released 2/8/24, prior 6.63%
It is too early in the new year to start sounding repetitive clarions about the U.S. economy, the consumer, and the stock market. Still, the data in front of us tells a positive story about the economy’s strength and the consumer’s resilience. Our expectations for rate cuts have been clear in that they are closer to May/June of 2024 than March 2024. Fed Chairman Jay Powell confirmed this notion last week at his press conference and on 60 Minutes. Why fight the Fed? If there is good news in this rate path, when the economy slows in 2024, rate cuts will boost a slowing economy. Lower rates later in 2024 will eventually be a natural tailwind for the equity and fixed-income markets. The salient point is that the next direction on rates is lower, not higher. We need to pay attention to the current data, not the data from the ’70s or ’80s because the market and information flow are different today than they were 50 years ago. Reach out to your financial advisor at Valley National Financial Advisors for assistance.
The health of the U.S. economy is a key driver of long-term returns in the stock market. Below, we grade key economic conditions that we believe are of particular importance to investors.
The “Heat Map” is a subjective analysis based upon metrics that VNFA’s investment committee believes are important to financial markets and the economy. The “Heat Map” is designed for informational purposes only and is not intended for use as a basis for investment decisions.
Questions can be submitted at yourfinancialchoices.com in advance of the live show. Recordings of past shows are available to listen or download at both yourfinancialchoices.com and wdiy.org