
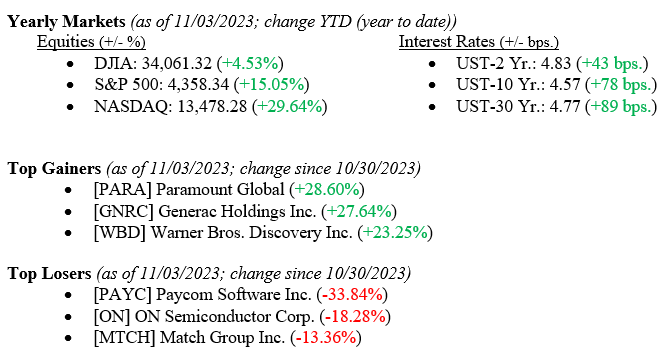
Oh, what a difference a week makes! Last week, you could read the financial press and see phrases like: “Sinking Stocks,” “Correction Territory,” and “The Bear Market is Here.” And then this week, we hear Fed Chairman Jay Powell repeat his previous month’s “We are going to listen to the data, but we are pausing rate hikes at this time.” Throw in a jobs number that showed hiring in the U.S. slowed a bit in September, and the stock market is off to the races with the largest one-week rally in 2023. See the weekly data below that shows each major market index returning 5%+ for the week, and even the oft-forgotten Russell 2000 Index of Small Cap stocks returned a positive +7.6%. Here at Valley National Financial Advisors, we have been cautiously optimistic all year by following the data and realizing there was too much good news and positive momentum to permit a recession in 2023. It seems the other economists, market prognosticators, and even the market itself have finally realized it, too. The 10-year U.S. Treasury closed the week at 4.57%, 27 basis points lower than the previous week.
Global Economy
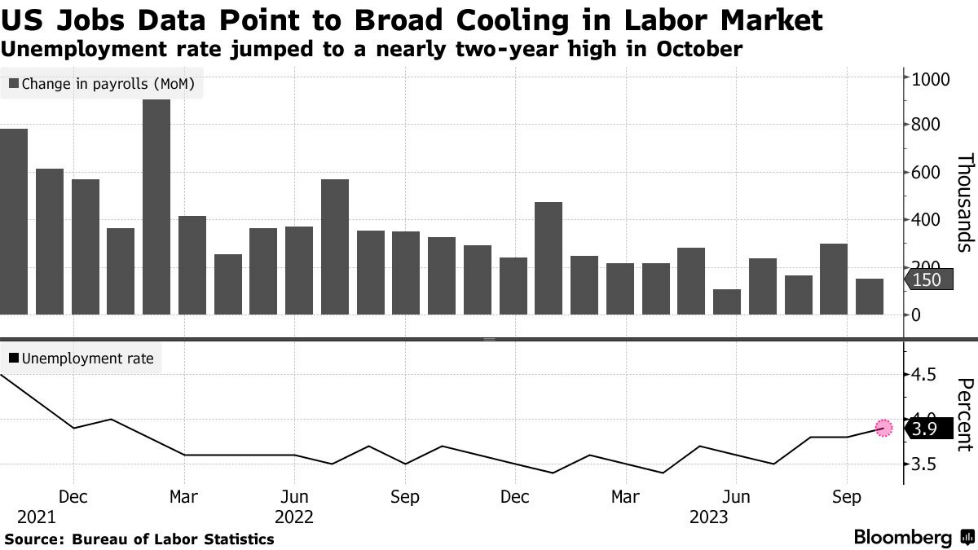
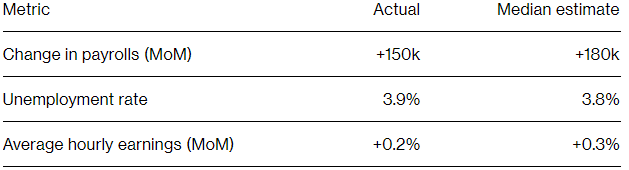
On Wednesday, the FOMC (Federal Open Market Committee) announced that it would be keeping rates at a 22-year high of 5.25-5.50% until at least their next meeting. However, economic data released on Friday surrounding nonfarm payrolls and unemployment suggest a cooling economy and that the Fed could be tightening in the near future. Nonfarm payrolls increased by 150,000 last month, less than expected, following a downwardly revised advance of 297,000 in September, according to the BLS (Bureau of Labor Statistics). Additionally, the unemployment rate climbed to 3.9% in October from 3.8% in September. Chart 1 below shows the last two years of month-over-month changes in payrolls and unemployment rate. Chart 2 shows actual data versus the median estimates.
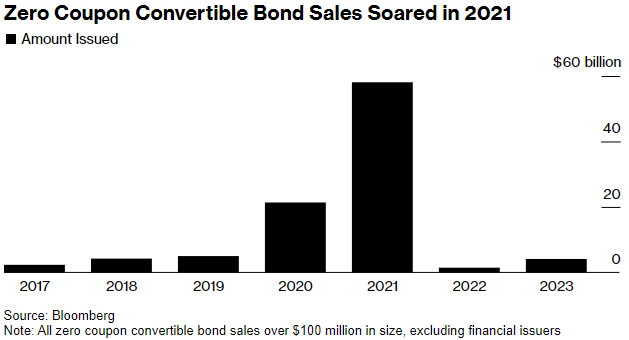
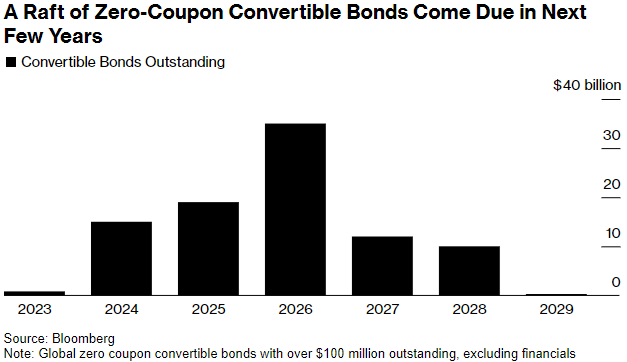
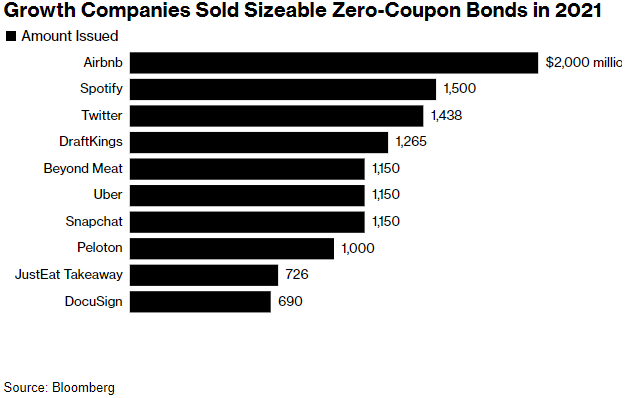
$69 billion of cheap and free debt issued during the pandemic is coming due within the next three years. During 2021, $58 billion of zero-coupon convertible bonds were issued, which was an increase of 1,100% over the two years prior. The need to refinance these bonds in a high-interest rate environment could pose a significant challenge to growth companies with low levels of cash generation. Chart 3 shows sales of zero-coupon convertible bonds since 2017. Chart 4 shows the maturation schedule of these debt obligations through 2029, and Chart 5 shows which companies had the largest issues.
What to Watch
- Monday, November 6th
- 4:30PM: Retail Gas Price (Prior: $3.60/gal.)
- Tuesday, November 7th
- 3:00PM: Consumer Credit Outstanding MoM (Prior: -$15.63B)
- Thursday, November 9th
- 8:30AM: Initial Claims for Unemployment Insurance (Prior: 217,000)
- 12:00PM: 30 Year Mortgage Rate (Prior: 7.76%)
- Friday, November 10th
- 10:00AM: Index of Consumer Sentiment (Prior: 63.80)
Certainly, last week was a good week for stocks and bonds, as both rallied significantly. We know one week does not make a year, but the news from the labor department showing slowing job growth was well received by investors. Perhaps the Fed is done raising rates, but one more 0.25% rate hike will not matter as much in the grand scheme of things anyway, and we have seen the economy easily absorb 550 basis points of rate hikes. The movement in the 10-year US Treasury (see above) was impressive, and clearly, the big money has already moved in favor of lower interest rates from here. November tends to be one of the best months for equities (just behind April), and Wall Street loves a December Santa Claus Rally as traders scramble for year-end performance. We will remain cautiously optimistic and follow the data because data is not emotional, but investors are. Please reach out to your financial advisor at Valley National Financial Advisors for help or questions.